
Figure 6.
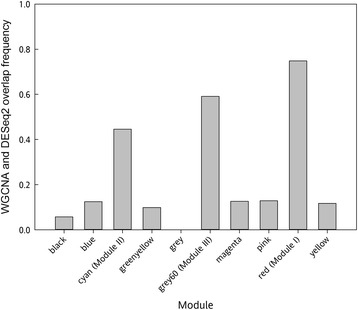
Frequency of overlapping contigs between DESeq2 and WGCNA. The bars represent the ten WGCNA modules and correspond to the frequency of overlapping contigs to the sequences that were obtained from the DESeq2 analysis. Cyan (Module II), grey60 (Module III) and red (Module I) have pollination-specific expression patterns.