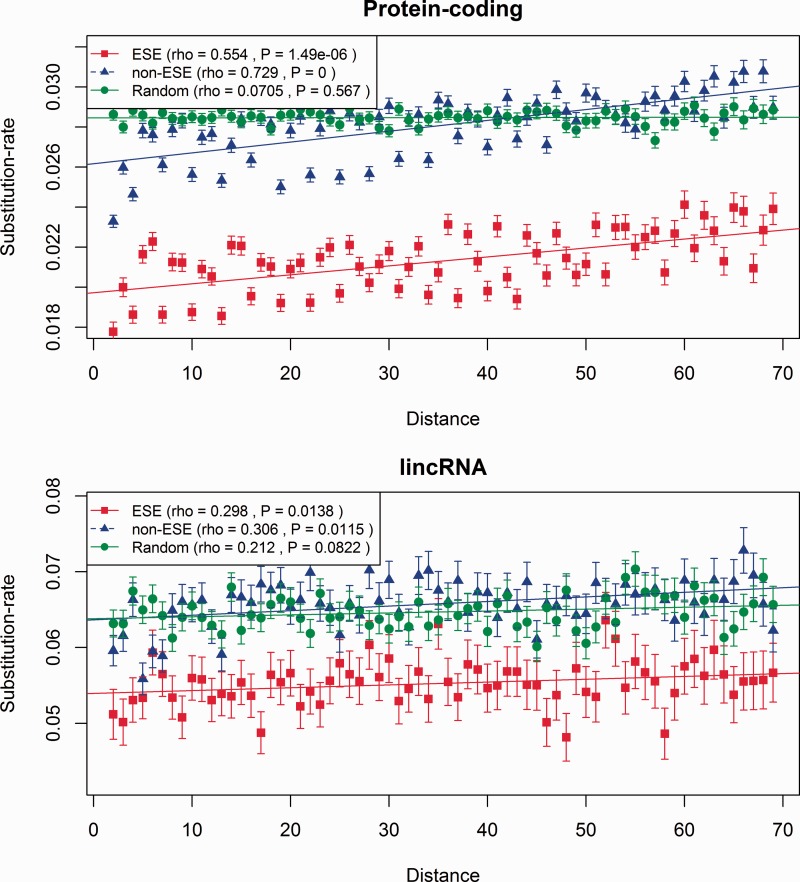
Fig. 2.
ESE motifs evolve slower than non-ESE sites. The substitution rates (number of substitutions divided by number of sites) in ESEs and non-ESEs are shown as a function of the distance in base pairs from the nearest splice-junction, for lincRNA (bottom) and protein-coding (top) genes. This figure includes only the conservative lincRNAs. For the complete set, see supplementary figure S2, Supplementary Material online. Bars indicate ± SEM.

