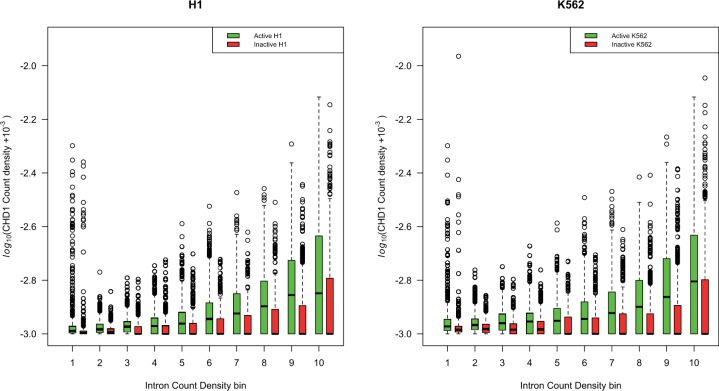
Fig. 6.
CHD1 density within lincRNAs is higher in active intron rich genes. Here, for each gene, we consider the number of CHD1 peaks (as specified by ENCODE) per unit base pair of each gene and compare this with the number of introns per unit base pair of gene length (in both cases we employ the length of the unspliced gene). We consider those lincRNAs that are transcriptionally active or inactive in each cell type separately. As can be seen, active genes have higher CHD1 density the more introns they have. For H1 active, rho = 0.23, P < 2.2 × 10⁻¹⁶, for K562 rho = 0.16, P < 2.2 × 10⁻¹⁶. For the inactives, the inverse is seen the effect being greatly owing to the great number of intron rich genes without any CHD1: For H1 inactive, rho = −0.11, P < 5.2 × 10⁻¹⁵, for K562 rho = −0.19, P < 2.2 × 10⁻¹⁶. Concerned that there were many tied values we examined the latter result using the Goodmans Kruskall gamma test, this being more robust to tied values. Results are unaffected (for H1 active, gamma = 0.2048, H1 inactive gamma = −0.0863, K562 active gamma = 0.1353, and K562 inactive gamma = −0.1382; all P’s < 0.001 from 1,000 simulations). Note that the genes considered active or inactive in the two cells are specific to each cell and the CHD1 measure is similarly specific to each cell type. Thus, the two cell types are independent tests of the same hypothesis. Considering CHD1 coverage (i.e., proportion of gene covered by at least one CHD1 span) does not affect conclusions: H1 active, rho = 0.1, P < 10−12, K562 active rho = 0.08, P < 10−8, inactives: H1 rho = −0.15, P < 2.2 × 10⁻¹⁶, K562 rho = −0.23, P < 2.2 × 10⁻¹⁶. Results are again robust to application of Goodmans Kruskal gamma (H1 active gamma = 0.0865, K562 active gamma = 0.0654 and H1 inactive gamma = −0.142 and K562 inactive gamma = −0.1834 and all P < 0.001, from 1,000 simulations).

