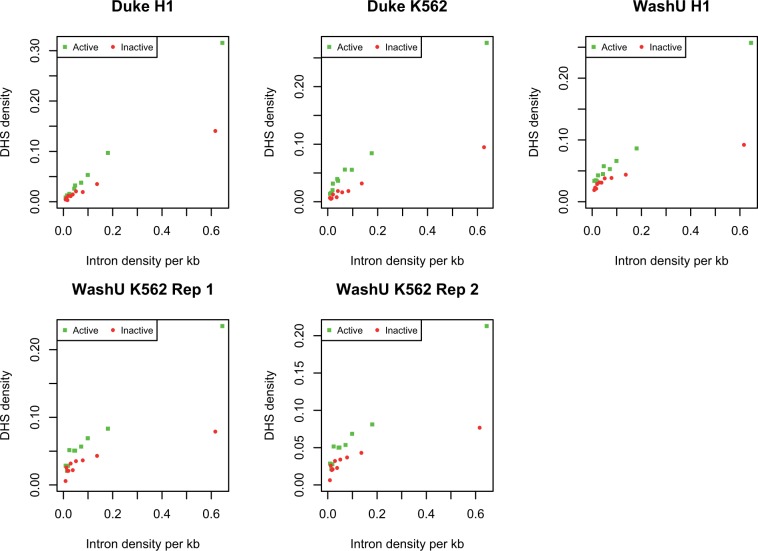
Fig. 7.
DHS density as a function of intron density for active and inactive genes. As within the WashU data set DHS density is rather low (such that most short genes have no DHS peak within the gene), we here analyze the data in manner designed to avoid the inherent stochasticity this induces. First, we rank all genes by total gene length (including introns). We then divide the data into bins of equal total gene size. With ten bins, the first bin contains the longest genes whose total length in approximately 1/10 the total gene length. Thus, each bin has different numbers of genes but an equal amount of total sampled DNA. We then calculate for each bin the total number of introns to derive the number of introns per kilobase of sequence. We also consider the total number of DHS peaks and calculate the number of these per kb. All correlations are significant at P < 0.0002 (Spearman). In all incidences, the mean DHS density is higher in the actives than the inactives (paired t-test, P < 0.05).

