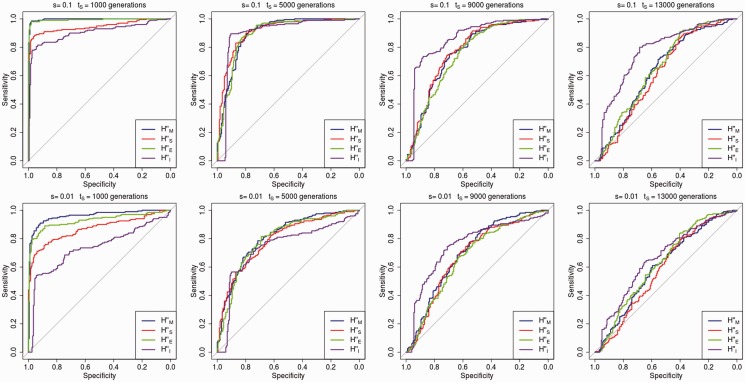
Fig. 7.
ROC curves showing performance in rejecting neutrality for different statistics (with SNP blocks of size 4) under different selection coefficients and times since fixation, when 200 modern human sequences are available (like in the 1000G data). Note that the specificity and sensitivity of H″I (relative to the other statistics) are higher than the specificity and sensitivity of other statistics when the sweep is ancient.

