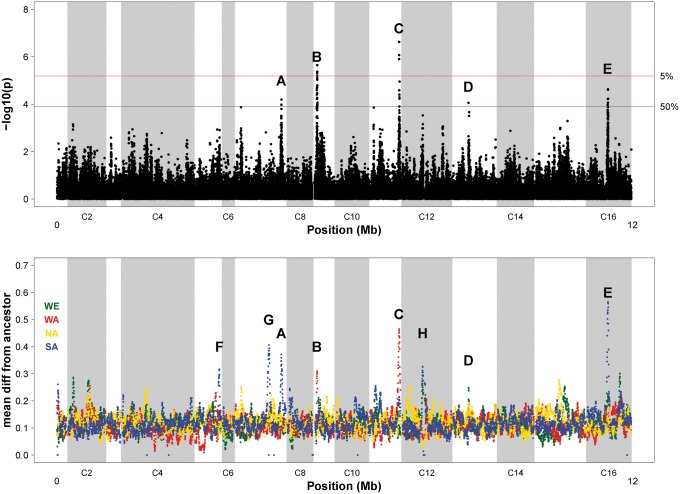
Fig. 2.
Evidence of allele frequency change across the genome. (a) Sites that have changed the most over time in all replicate populations. Results of a genome scan for SNPs with significant variation in allele frequency between sampled timepoints (via an ANOVA on square root arcsin transformed allele frequencies treating “generation” as a continuous variable). y-Axis values indicate transformed p-values from this ANOVA, such that higher values indicate higher levels of significance; the blue and red horizontal lines represent our empirically determined genome-wide alpha of 0.5 and 0.05, respectively. We find five peak regions that exceed our lower threshold, and label these A–E. (b) Haplotype change across the genome, represented as the average difference between founder haplotype frequency at week 18 from the ancestral founder haplotype frequency. We find three additional peaks and label these F–H. Note that absolute frequency differences are plotted for easier visualization; relative frequency differences are plotted in supplementary fig. S6 for comparison.

