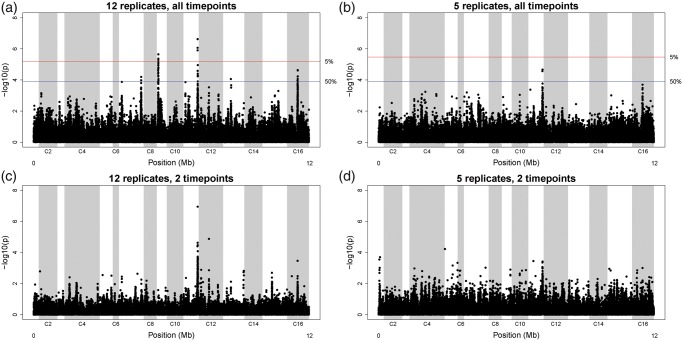
Fig. 4.
Effects of replication and sampling on signal. ANOVA analysis used to generate fig. 2 was carried out on (a) the entire data set consisting of all 12 replicate populations sampled at four timepoints (0, 180, 360, and 540 generations); (b) a data set consisting of only five replicate populations sampled at the same four timepoints; (c) a data set consisting of all twelve replicate populations sampled at two timepoints (zero and 360 generations) and (d) a data setconsisting of five replicate populations sampled at these two timepoints. Increasing both replication and sampling results in stronger, more localized signals of change.

