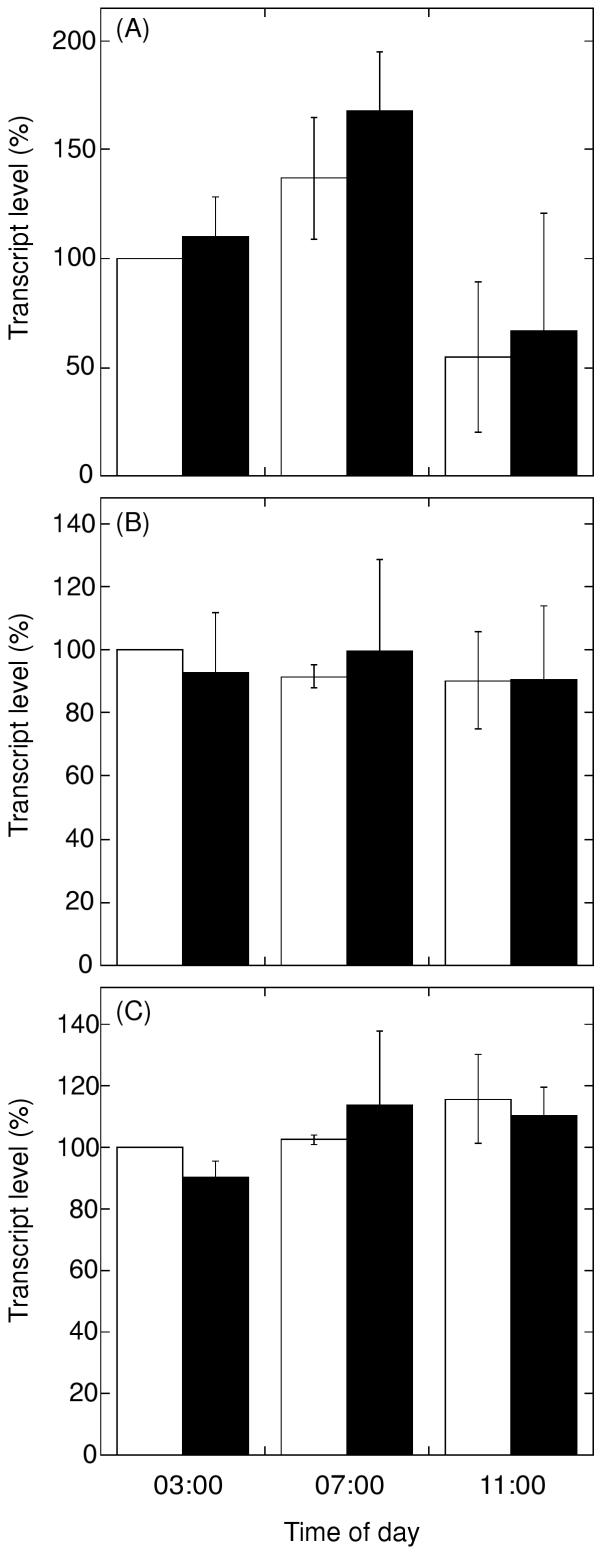
Figure 5.

Transcript quantification by real-time PCR in control and antimycin A-treated potato leaves. Potato plants were sprayed at 03:00 h, one hour before light, and leaf samples were collected at start of the treatment (03:00 h), after 4 h (at 07:00 h) and after 8 h (at 11:00 h). White columns, leaves sprayed with solvent only. Black columns, leaves sprayed with 10 μM antimycin A. Transcript abundance is shown for nda1 (A), TC54504 (B) and the 28.5 kDa subunit of complex I (C). Transcript levels are given as percent of the level in the control plants at the start of the treatment (03:00 h). The error bars indicate standard deviation (n = 2).
