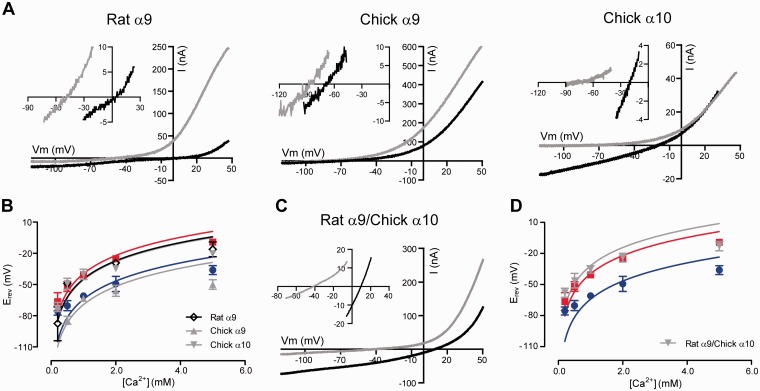
Fig. 2.
Homomeric and hybrid receptors have different relative calcium permeabilities. (A) Representative I–V curves obtained by application of voltage ramps (−120 to +50 mV, 2 s) at the plateau of the response to 100 μM ACh in oocytes superfused with NMG+-based solutions containing different Ca2+ concentrations (0.5 mM, gray and 5 mM, black) for oocytes expressing either rat α9 (upper left), chicken α9 (upper middle), or chicken α10 (upper right) nAChRs. Insets: Magnification near the Erev. (B) Plot of Erev values as a function of extracellular Ca2+ concentration for rat α9, chicken α9, and chicken α10 homomeric nAChRs. Erev values for rat α9α10 (red) and chicken α9α10 (blue) are shown for comparison. Values are mean ± SEM of 4–12 experiments per group. Solid lines are fit to the GHK equation (see Materials and Methods). (C) Idem as in (A) for oocytes expressing rat α9/chicken α10 hybrid nAChRs. (D) Idem as in (B) for the rat α9/chicken α10 hybrid nAChR.

