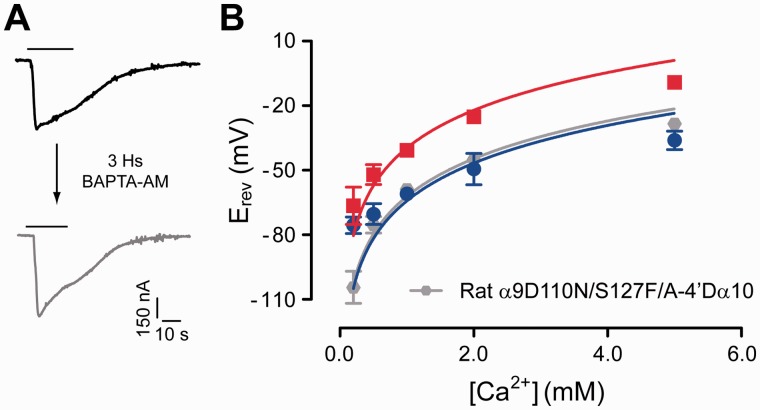
Fig. 7.
The rat α9N110D/S127F/A-4′Dα10 triple mutant shows avian-like low calcium permeability. (A) Representative traces of responses evoked by 100 μM ACh in oocytes expressing the rat α9N110D/S127F/A-4′Dα10 triple mutant receptor, before (left—black trace) and after (right—gray trace) a 3-h incubation with the fast calcium chelator BAPTA-AM (Vhold = −70 mV; [Ca2+]extracellular = 1.8 mM). Traces are representative of n = 6. (B) Plot of Erev values as a function of extracellular Ca2+ concentration for the rat α9N110D/S127F/A-4′Dα10 triple mutant receptor. Erev values for rat α9α10 (red) and chicken α9α10 (blue) are shown for comparison. Values are mean ± SEM of 7–11 experiments per group. Solid lines are fit to the GHK equation (see Materials and Methods).

