
Figure 7.
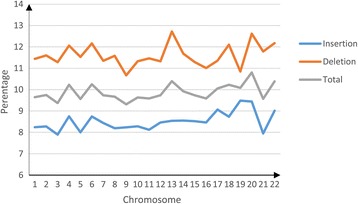
The percentage of redundant indels for human chromosome across 1–22. Blue line represents Insertion type indels; Orange line represents Deletion type indels; Gray line represents total inels (Insertion type + Deletion type).
Official websites use .gov
A
.gov website belongs to an official
government organization in the United States.
Secure .gov websites use HTTPS
A lock (
) or https:// means you've safely
connected to the .gov website. Share sensitive
information only on official, secure websites.
The percentage of redundant indels for human chromosome across 1–22. Blue line represents Insertion type indels; Orange line represents Deletion type indels; Gray line represents total inels (Insertion type + Deletion type).