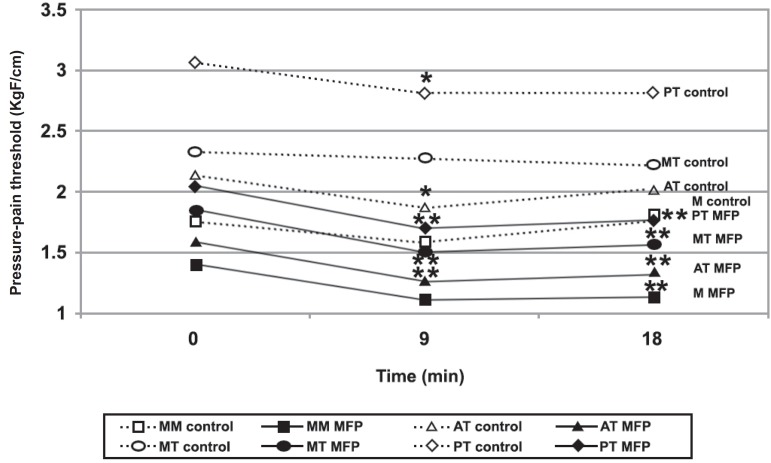
Figure 2.
Pressure-pain threshold (PPT) during chewing test [patients with myofascial pain (MFP X control)]. * significant difference from PPT0 in the same muscle, for the control group. ** significant difference from PPT0 in the same muscle, in the MFP group. MM=superficial masseter body; MT= medium temporalis; AT= anterior temporalis; PT= posterior temporalis

