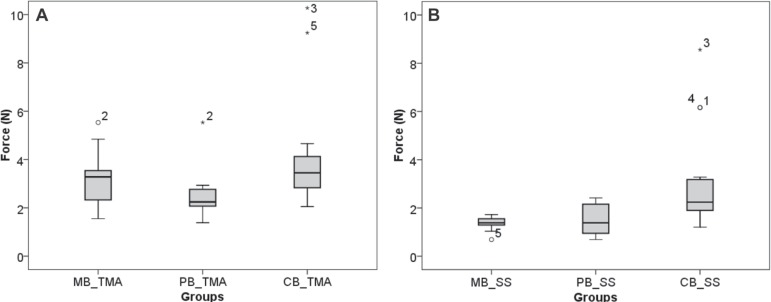
Figure 3.
Box plot showing maximum frictional coefficients between metal, polycarbonate, and ceramic brackets in association with different wires: A) Stainless steel wire; B) Titanium-molybdenum alloy (TMA) wire. Simple analysis of variance (ANOVA) and Tukey’s test as post hoc multiple comparison test at confidence interval of 95% (* p<0.05)

