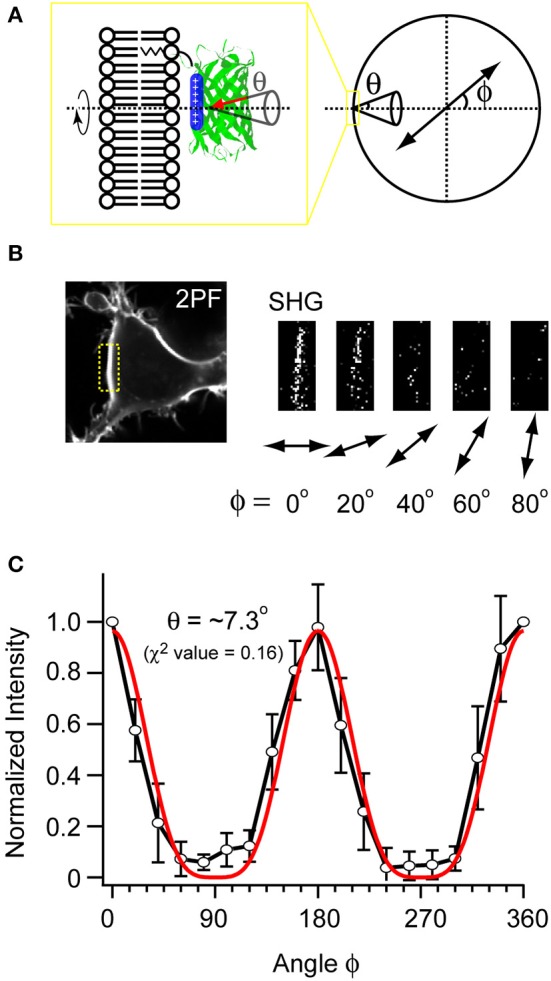
Figure 5.

Measuring the orientation of mVe9Knus-CVIM at the membrane interface. (A) A scheme illustrating the parameters. ϕ: angle of the polarization plane with respect to the membrane normal. θ: tilt angle of chromophore's uniaxial hyperpolarizability with respect to the membrane normal. The cone represents the distributions on ensemble. (B) Example images obtained with five different polarization angles (ϕ). (C) The pooled data (black plot; average ± SD; n = 6), and its fit (red plot).
