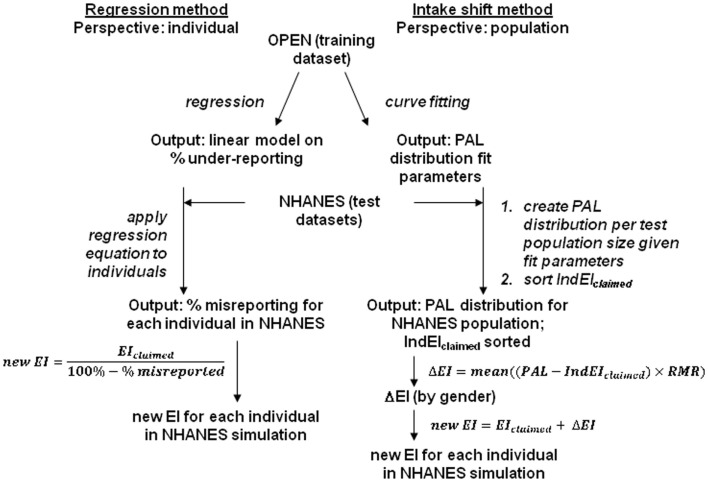
Figure 1.
Flow chart for the development and implementation of dietary recall correction models. Left side, regression model: right side, intake shift model. Two separate analyses on the OPEN dataset produced output models that were then used in simulation models with National Health and Nutrition Examination Survey (NHANES) datasets. The simulations gave final outputs that were used to estimate a corrected energy intake (EI). Physical activity level (PAL) = energy expenditure/resting metabolic rate (RMR); IndEIclaimed = EIclaimed/RMR; OPEN = observing protein and energy nutrition.

