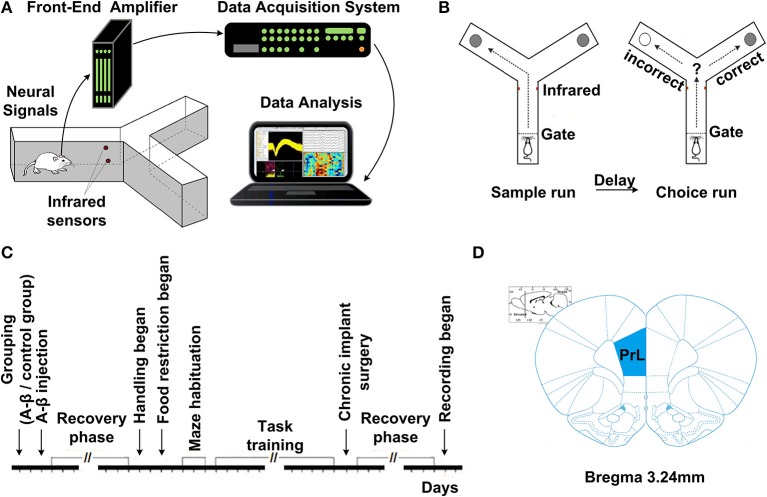
Figure 1.
Experiment setup and procedures. (A) Diagram of experimental setup, consisting of a rat with implanted microelectrodes in a Y-maze, the Cerebus front-end amplifier, the Cerebus data acquisition system and analysis software. (B) Schematic representation of the delayed-alternation task in Y-maze. Dashed lines represent the locations of removable guillotine doors that restricted access to different parts of the maze. Food cups, which are used for reward delivery, are located at the ends of two arms. Arrows show possible correct paths. Each trial consisted of a sample run and a choice run. On a sample run, both the left- and right-arms of the maze are baited and rats could get food by entering into either of them. After a 5 s delay, the rats would have a choice run. Rats have to avoid the arm visited in the sample run and enter into the opposite arm to get reward. (C) Time line of the various phases of experiment. (D) Diagram of coronal sections showing the level and position of the medial prefrontal cortex, taken from the Stereotaxic Coordinates (Paxinos and Watson, 2005). The number indicates the antero-posterior coordinates caudal to bregma.

