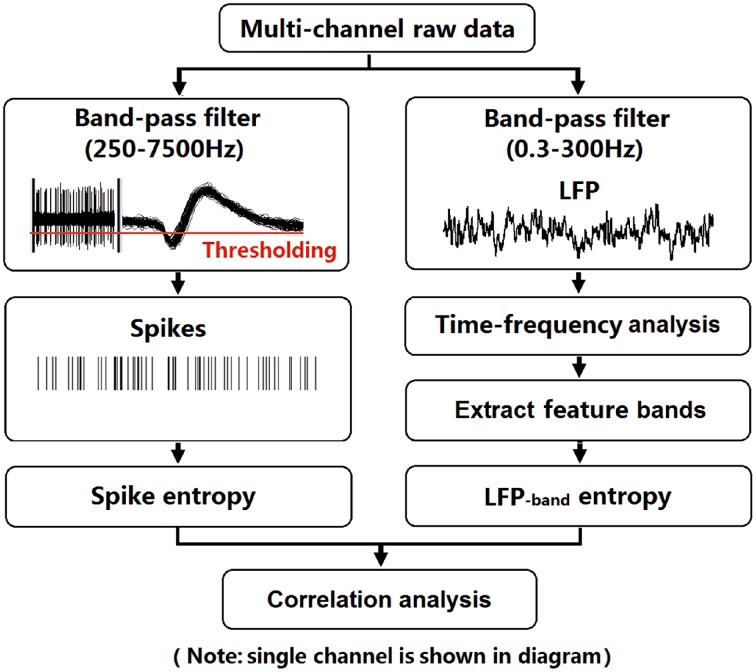
Figure 2.
Flow chart for data analysis. To illustrate the procedure, we selected an arbitrary single channel to display. LFPs (band-pass filter: 0.3–300 Hz) were obtained from raw data via digital filters. Feature bands were further extracted according to the results of time-frequency spectral analysis. Spikes (band-pass filter: 250–7500 Hz) exceeding a preset voltage threshold were sampled at 30 kHz and were stored with time stamps. Then, entropy estimation of LFPs and spikes were performed. Finally, the correlation of spike entropy and LFP entropy was calculated to assess the spike-LFP coordination.

