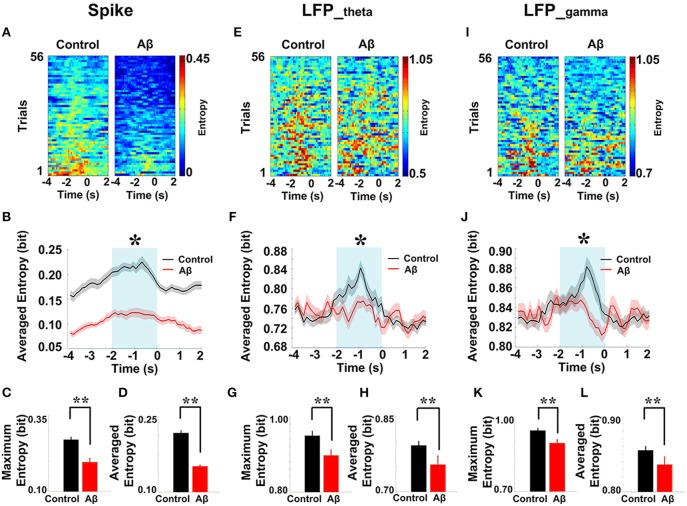
Figure 7.
Dynamic entropy of neural activity in rat PFC during the working memory task in the Aβ (n = 56 trials) and control (n = 56 trials) groups. (A) Dynamic entropy of spikes from example trials (left: control; right: Aβ). (B) Averaged entropy of spikes across all trials in Aβ (red) and control (black) groups. The shaded region indicates s.e.m. The light blue area indicates the period used for statistical analysis. Averaged entropy values were compared between two groups in this time window (*P < 0.05). (C) Peaks of entropy values (*P < 0.05, **P < 0.01). (D) Average of entropy values. (E) Dynamic entropy of theta-band LFP. (F) Averaged entropy of theta band LFP across all trials in Aβ and control. (G) Peaks of entropy values. (H) Average entropy values. (I) Dynamic entropy of gamma band LFP. (J) Averaged entropy of gamma-band LFP across all trials. (K) Peaks of entropy values. (L) Average entropy values.

