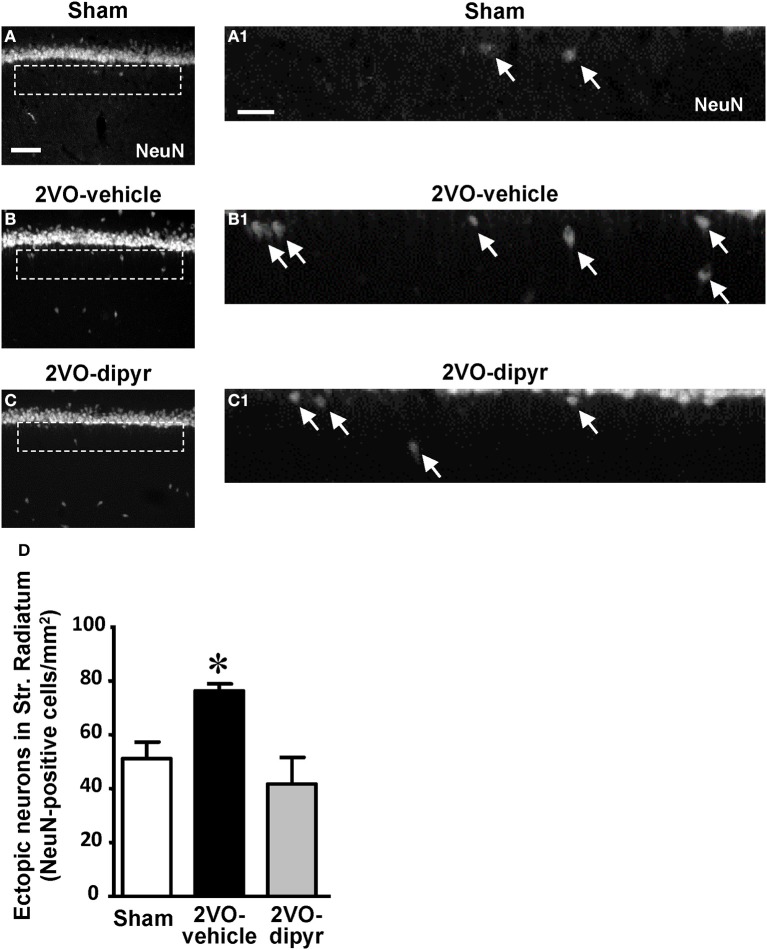
Figure 2.
Quantitative analysis of ectopic neurons in CA1 Str. Radiatum. (A–C) Representative photomicrographs of immunostained neurons (NeuN positive), taken at an epifluorescent microscope, in CA1 Str. Pyramidale and CA1 Str. Radiatum of a sham (A), a 2VO-vehicle (B), and a 2VO-dipyridamole rat (C). Images show the presence of ectopic neurons in the Str. Radiatum within 100 μm from the Str. Pyramidale. Scale bar: 70 μm. (A1–C1) Higher magnification images of the framed areas shown in (A–C), respectively. Arrows indicate ectopic neurons. Scale bar: 25 μm. (D) Quantitative analysis of ectopic neurons in CA1 Str. Radiatum of sham (white column, n = 7), 2VO-vehicle (black column, n = 8), and 2VO-dipyridamole (gray column, n = 8) rats (ectopic neurons/mm2; mean ± s.e.m.; *at least P < 0.05 vs. sham and 2VO-dipyridamole rats, One-Way ANOVA followed by Newman–Keuls Multiple Comparison Test). Quantification was performed blind by two researchers in the region of interest (ROI) of CA1 Str. Radiatum and results were averaged. ROIs were calculated in mm2 and the counts of NeuN immunopositive cells were expressed as neurons/mm2.

