Figure 3.
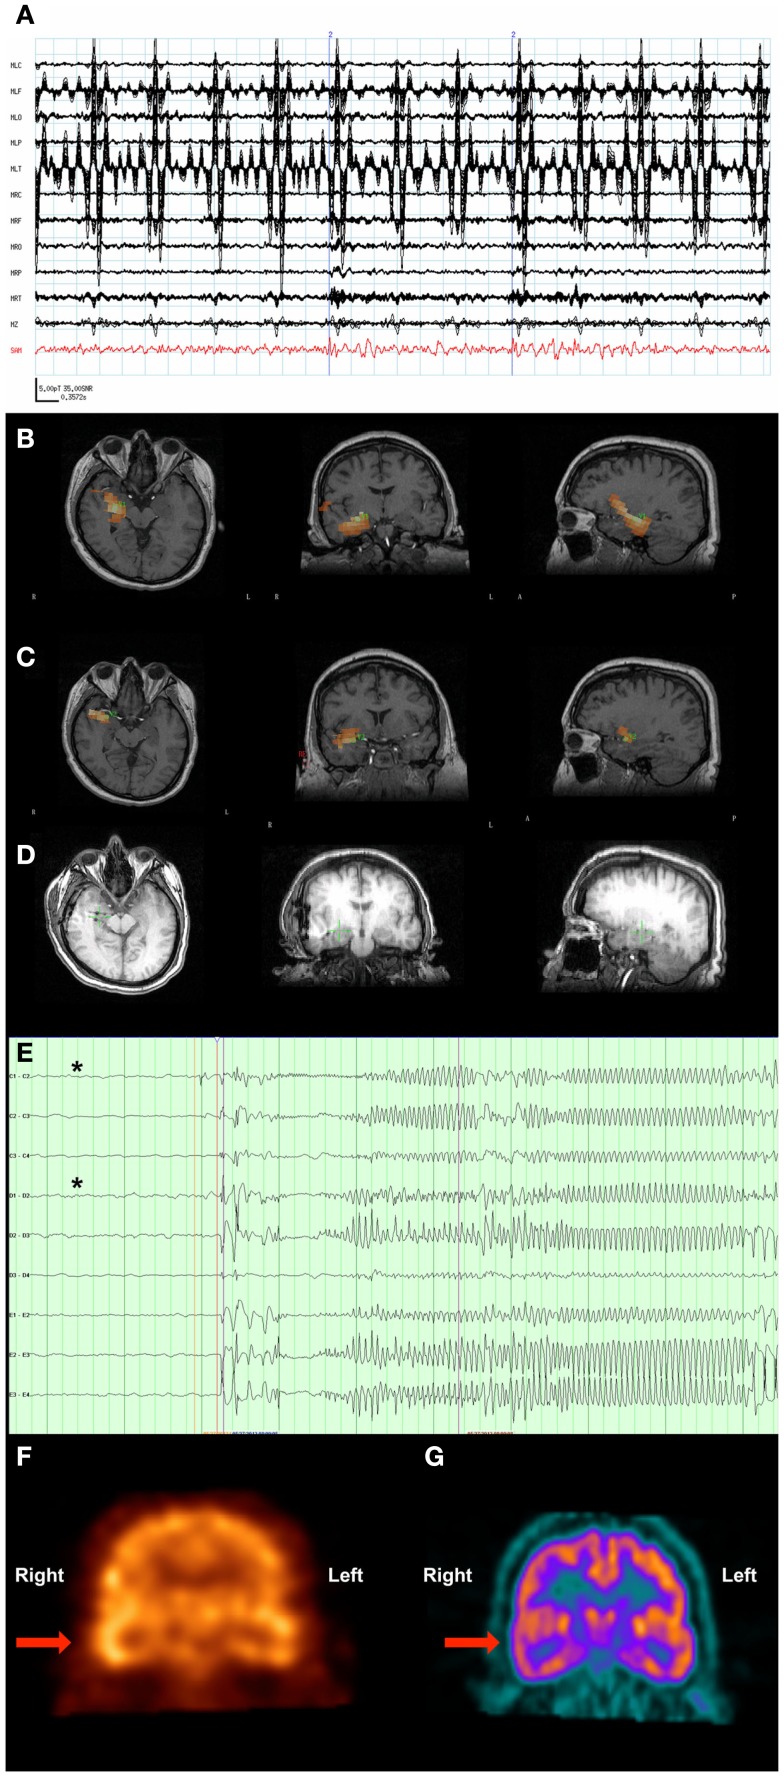
Patient 3. (A) The raw MEG sensor data (black traces) exhibited strong artifacts due the patient’s VNS, but the source signal reconstruction (red) from the amygdala displayed clear spikes. (B) The SAM(g2) statistical parametric maps indicated a right hippocampal focus as well as (C) another focus in the amygdala. (D) A CT scan reveals the placement of the hippocampal and amydalar depth electrodes, as well as the location of the hippocampal focus (green cross) as identified by SAM(g2). (E) An example of a seizure that arose from the anterior hippocampal and amygdalar electrodes, (black asterisks). (F) A coronal plane ictal SPECT image demonstrating hyperperfusion of the right temporal lobe (arrow). (G) A coronal plane 18F-FDG PET image demonstrating hypometabolism of the right temporal lobe (arrow).

