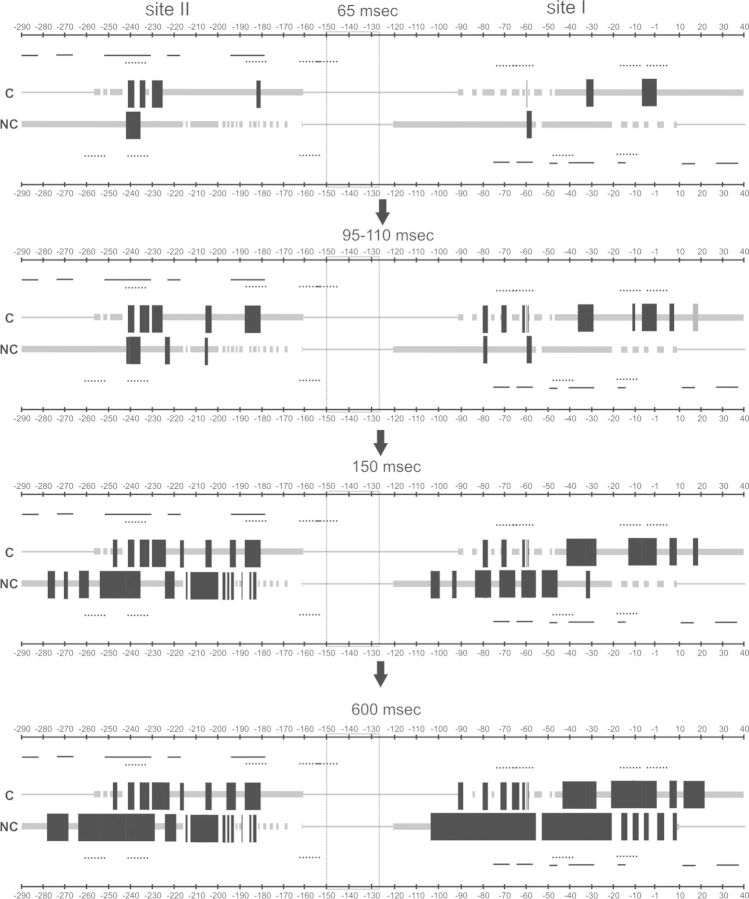
Figure 8.
Schematic representation of the time-resolved H-NS binding events on the virF promoter region. The coding (C) and non-coding (NC) DNA strands of the virF promoter are depicted as parallel lines, thicker in the portions representing the regions analyzed in this work. The black blocks placed on the strands indicate H-NS protections from Fe-EDTA cleavage of the corresponding phosphodiester bond. Only H-NS binding events which resulted in >25% Fe-EDTA shielding after 65, 95–110, 150 and 600 ms are shown. The H-NS protection pattern is in scale and the numbering is given according to the +1 transcription start site. Gaps interrupting both lines and blocks correspond to regions in which the effect of H-NS binding could not be clearly determined. The location of the main curvature is indicated by a box placed between site I and site II. The lines positioned above the C-strand and below the NC-strand indicate the predicted H-NS binding motifs (dotted lines) and the H-NSctd binding sites detected by DNase I footprinting analysis (solid lines). Only the sequences with at least 4/6 bases identical to the core sequence of the H-NS binding motif are shown. See the text for further explanation.

