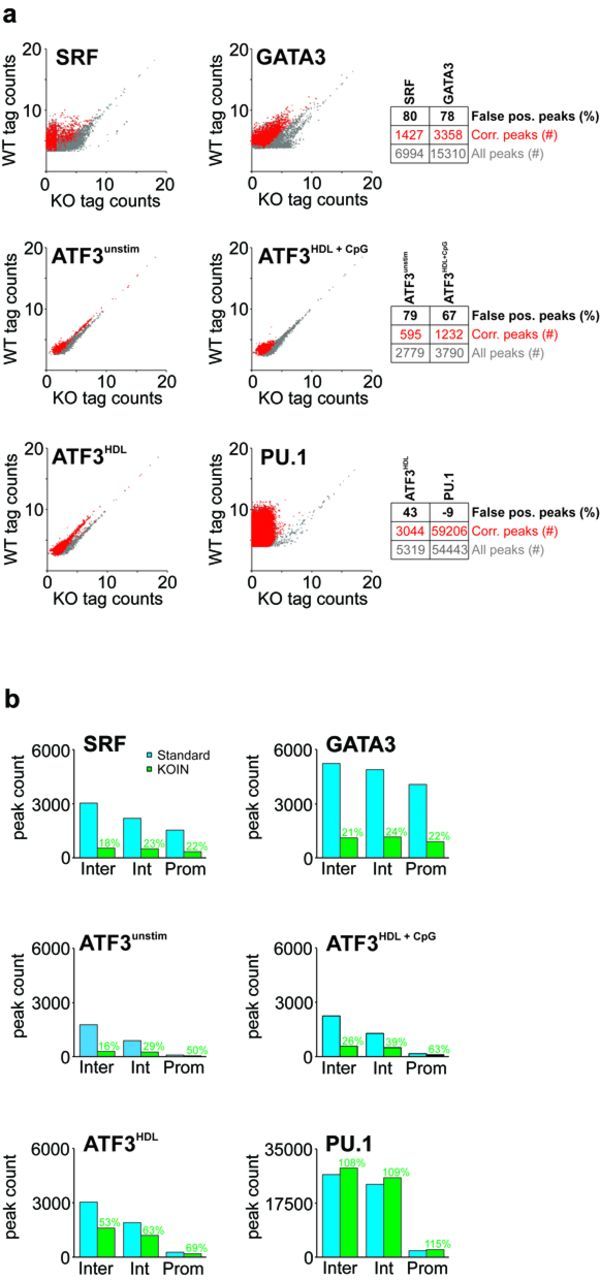
Figure 2.

Global TF-binding distributions in independent ChIP-seq experiments reveal distinct false-positive signals. (a) Normalized ChIP-seq tag counts (log2 scale) for PU.1, SRF, GATA3 and ATF3 (under indicated stimulatory conditions) of uncorrected data derived from WT samples are plotted against tag counts derived from TF-KO samples (gray dots). Remaining peaks after KOIN-correction are overlaid (red dots). To avoid overlaps of a high fraction of data points Jitter was added. Numbers of total peaks, KOIN-corrected peaks and the false-positive peak rate (in percent) are presented as a table next to the dot plots. (b) Peak counts at promoter (Prom), intronic (Int) and intergenic (Inter) genomic regions are compared before (blue) and after (green) KOIN correction. Percentages of remaining peak numbers after correction (true positives) are included (green).
