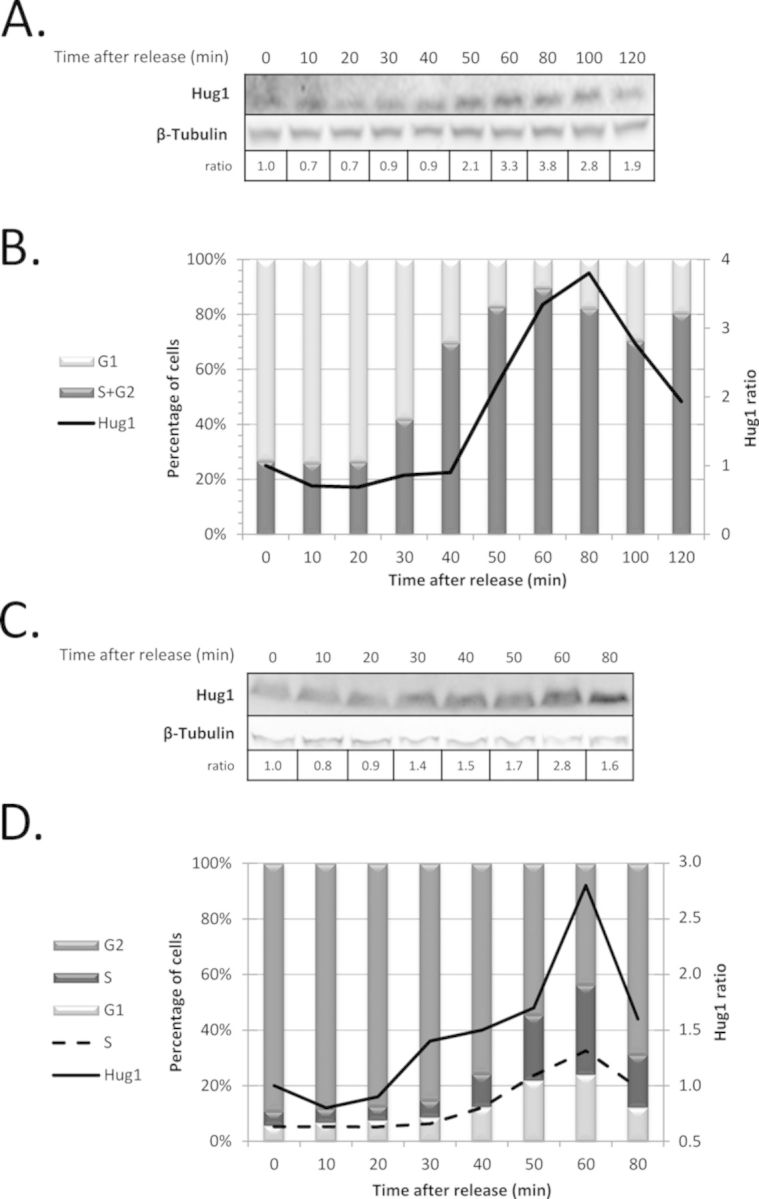
Figure 2.

Hug1 level is regulated during the cell cycle. Cells were synchronized during 2 h using alpha-factor (A, B) or nocodazole (C, D). At different time points after release as indicated, protein extracts were prepared for western-blotting analysis (A, C) and cell samples were analysed by flow cytometry to quantitate cell-cycle progression (B, D). The chemiluminescent signal obtained in western blot using anti-Hug1 serum and anti-β-tubulin was quantified using ImageJ (NIH). Hug1/β-tubulin signal ratio is indicated below blot images (A, C) and reported as a solid line in quantitative analysis of cell-cycle plots (B, D). Medium gray, dark gray and light grey bars represent the percentages of cells in G2, S and G1 phases respectively, which were calculated from flow cytometry data using FlowJo (Tree Star); the percentage of cells in S phase is also represented by a dashed line (D).
