Figure 5.

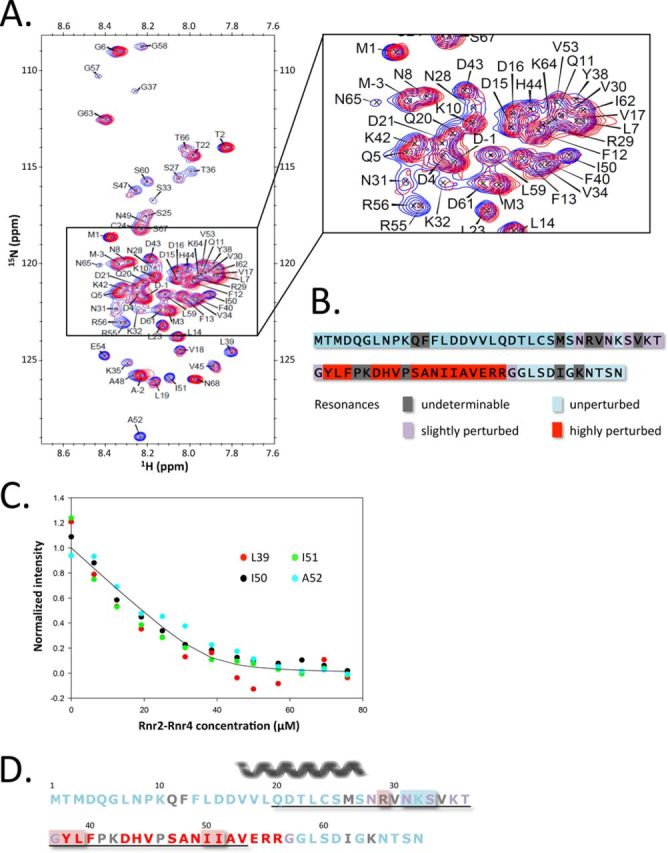
Characterization of the interaction of Hug1 with the Rnr2–Rnr4 complex. (A) 15N, 1H –HSQC spectra of 15N-labeled Hug1 at pH 7.5 and 9°C in the absence (blue contours) and in the presence (magenta contours) of saturating amounts of the unlabeled Rnr2–Rnr4 complex (at 1:2 Hug1:Rnr2/4 ratio) are superposed. The concentration of Hug1 is 16.4 μM. (B) Schematic representation of Hug1 sequence indicating residues for which resonance in 15N, 1H –HSQC spectra was highly perturbed (red), slightly perturbed (purple), unperturbed (light blue) upon Rnr2–Rnr4 addition. Residues for which we could not unambiguously determine if resonance was perturbed are indicated in gray. (C) Normalized peak intensities measured in 15N, 1H –HSQC spectra at 22°C were reported as a function of Rnr2–Rnr4 concentration. The concentration of Hug1 is 50 μM. The curve represents the best-fit solution of the exponential equation that describes 1:1 complex formation. The curve corresponds to KD = 1.6 μM ± 0.6 μM. (D) Residues of Hug1 involved in Rnr2 binding. Residues that are highly affected by the presence of Rnr2 in NMR experiments are indicated in red, residues that are slightly affected in purple and residues that are unaffected are indicated in light blue. Residues for which mutation abolished 2H interaction with Rnr2 are shown over red background whereas those for which mutation had no effect in our 2H assay are shown over light blue background. Residues for which participation in binding is unknown are indicated in gray. Residues belonging to the Hug domain are underlined. The nascent alpha-helix is indicated above the sequence.
