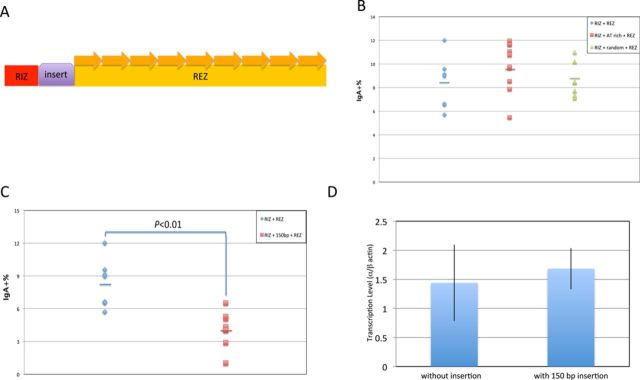
Figure 3.

R-loops can proceed across a short region of DNA that has a low G-density. (A) DNA with different lengths (purple) were inserted between RIZ (containing 5 G-clusters) and REZ (containing 9 repeats with high G-density and 4 AGCT sites within each repeat). (B) A 50-bp segment of DNA with either AT-rich sequence or random sequence was inserted between RIZ and REZ. FACS analysis is shown. Each data symbol represents an independent clone. The bars represent the mean of each group. (C) A 150-bp segment of DNA with AT-rich sequence was inserted between RIZ and REZ. FACS analysis is shown. Each data symbol represents an independent clone. The bars represent the mean of each group. The Student's t-test was used to analyze the effect of the insert. (D) Transcription assay for the clones in panel C. The same method was used as described in Figure 1D and in the Materials and Methods. We observe no significant difference in transcription here in panel D.
