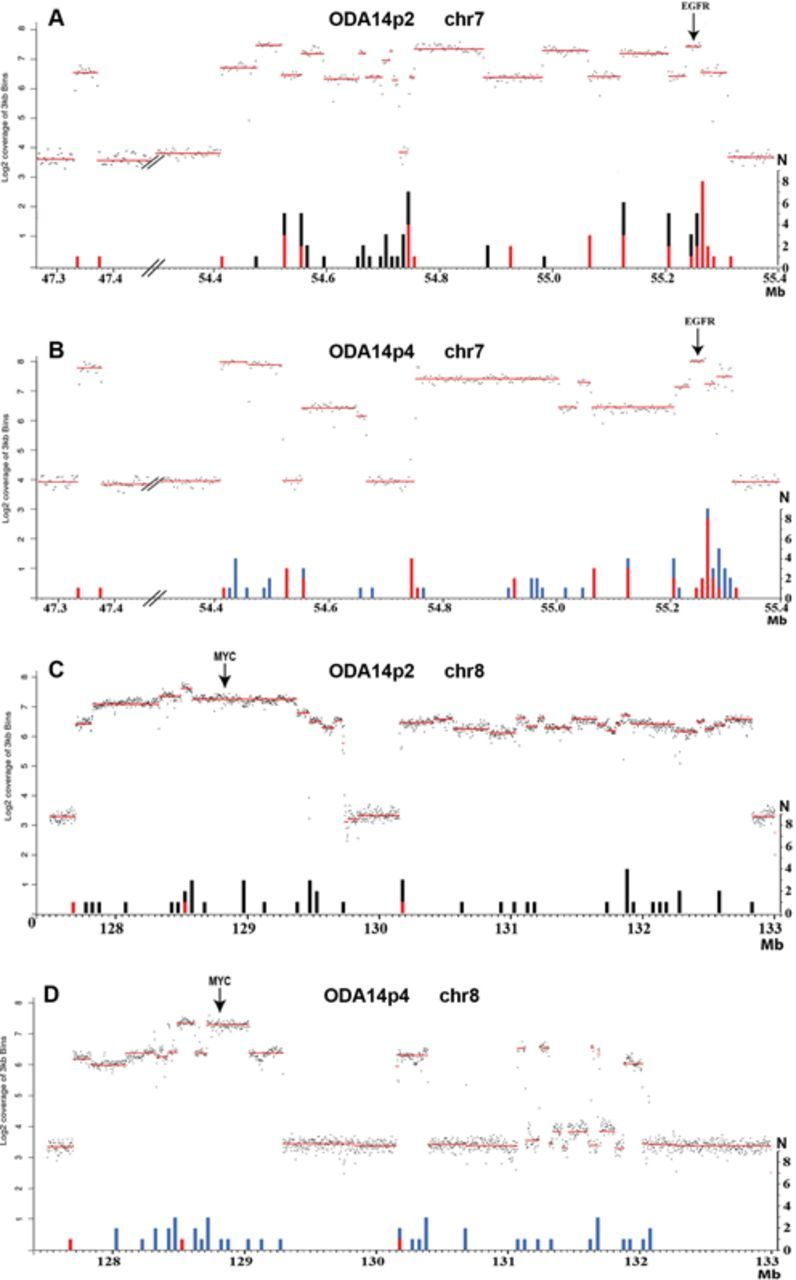
Figure 2.

Genome sequencing coverage (3 kb bins) in the amplified regions of chromosomes 7 and 8 in ODA14p2 (A and C) and ODAp4 (B and D). The amplified regions are in dmins in ODA14p2 and in an hsr in ODA14p4. The log2 coverage profiles (upper parts, left scale) and the number of junctions (N) (lower part, right scale) are reported as a function of the position on the chromosome (in Mb). Three copies of chromosome 7 and two copies of chromosome 8 were present in the cells (Figure 1) corresponding to a coverage of the non-amplified regions near 4 and 3 for chromosome 7 and 8, respectively (see also Supplementary Data S1). Junctions were pooled by regions of 10 kb for chromosome 7 and 50 kb for chromosome 8. A and C: red, junctions remaining in ODA14p4; black, junctions not found in ODA14p4. B and D: red, junctions already present in ODA14p2; blue, new junctions.
