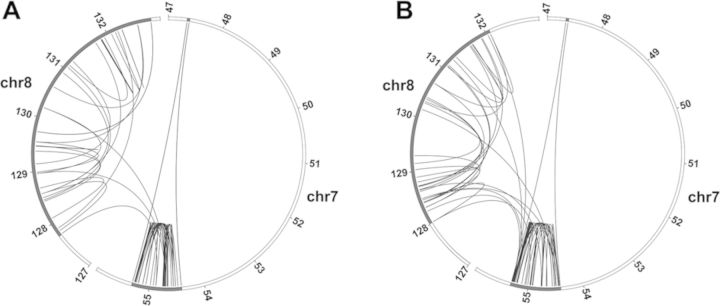
Figure 3.

Circos plots of the position of the junctions in the amplified regions. (A) ODA14p2. B. ODA14p4. The amplified regions are in dmins in ODA14p2 and in an hsr in ODA14p4. Partial chromosome 7 and 8 regions are presented: the regions including the amplified sequences are in black. Only the junctions with the two arm sequences from the amplified regions are shown. Junctions were mainly between sequences from the same chromosome. A few interchromosomal junctions were present in ODA14p2 and their number increased in ODA14p4.
