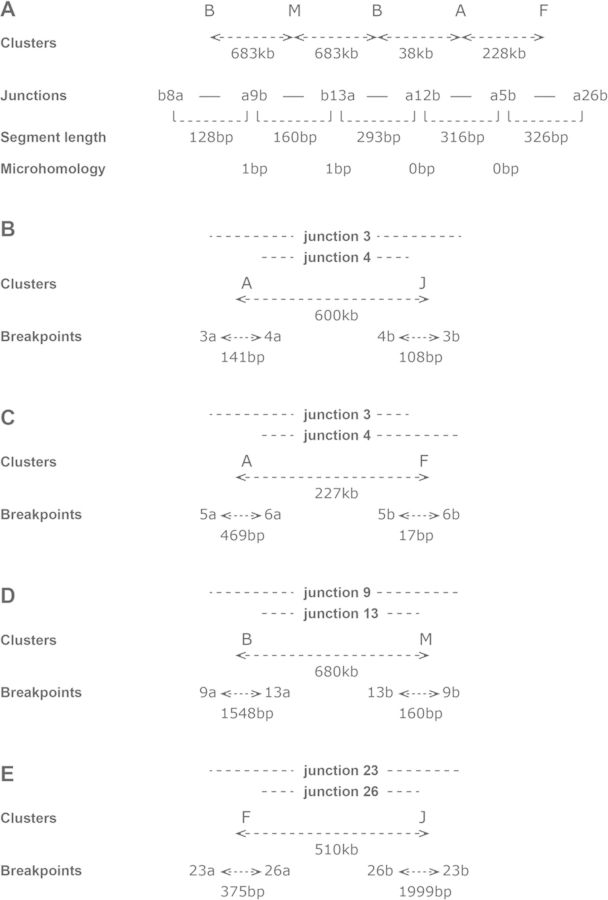
Figure 6.
Concomitant formation of junctions in amplified regions of ODA14. Clusters are listed in Table 1, junctions are described in Supplementary Table S1 and a and b identify the two arms of the junctions. (A) Contig 7. The clusters that are tha source of the segments constituting the contig are indicated, with the distance between clusters in the normal genome. The length of segments and of the microhomologies at the junction are indicated. Two neighbouring segments from cluster B were associated with a segment from cluster M localized 683 kb away in the normal genome. This suggests that the chromosome regions of clusters B and M remained closely associated during the formation of the junctions. (B–E) Association between pairs of junctions. Clusters: clusters containing the breakpoints and distance between the clusters in the normal genome. Breakpoints: distance between the breakpoints in the clusters. This indicates that sequences localized hundreds of kb apart were put together and that the formation of each pair of junctions was concomitant.

