
Figure 1.
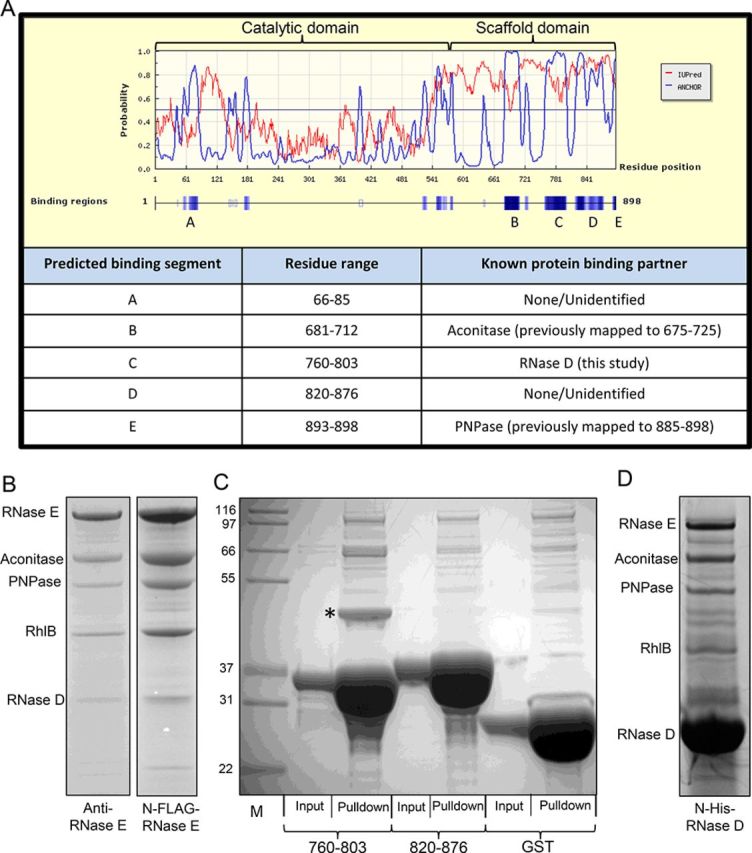
Small recognition motifs in Caulobacter crescentus RNase E. (A) ANCHOR prediction (blue line) of protein–protein interaction sites within RNase E (labelled A–E). The red line corresponds to the IUPred prediction of intrinsically unstructured regions. Bottom, a table summarizing the ANCHOR predicted protein-binding sites and known protein binding partners. The ANCHOR maxima at residue 180 and 550 correspond to regions that are not solvent exposed and are involved in intra-domain interactions respectively in the Escherichia coli crystal structure. (B) Co-immunopurification of C. crescentus RNA degradosome via anti-RNase E antibody, or N-terminally FLAG tagged RNase E. (C) Pull down experiment with GST fusions of ANCHOR predicted protein binding segments, or GST alone. RNase D is marked with an asterisk. (D) Reciprocal pull down experiment using 6xHis-tagged RNase D as bait. Controls are shown in Supplementary Figure S3.