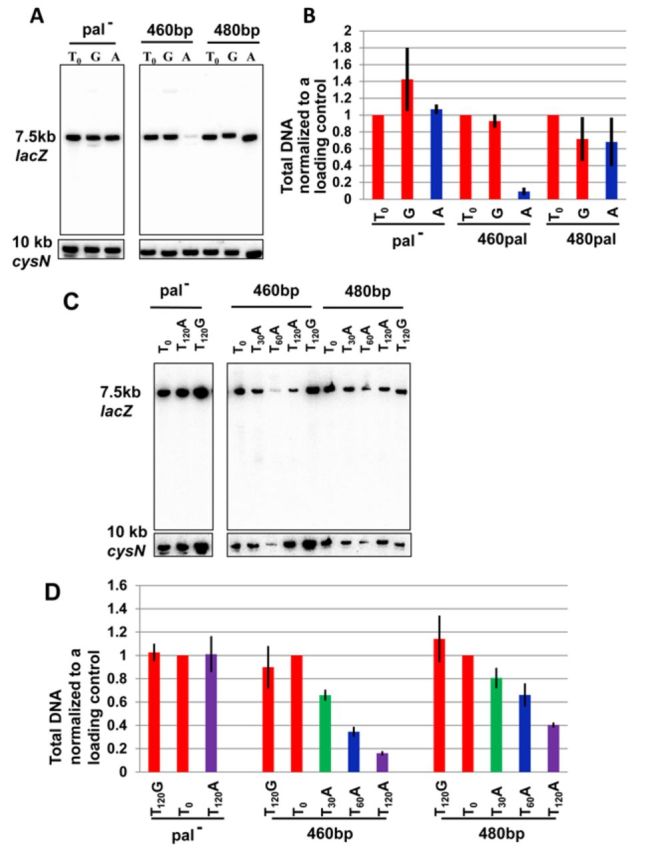
Figure 5.

(A and B) Quantification of DNA loss surrounding the break in palindrome-containing and palindrome-free recombination proficient cells. (A) Top panel. Southern blot showing the 7.5 kb NdeI lacZ fragment containing the palindrome. Lower panel. Southern blot showing the 10 kb NdeI cysN fragment. (B) Quantification of DNA loss. The total amount of DNA from each sample was quantified and normalized to the total DNA for the 10 kb NdeI cysN fragment on the opposite side of the chromosome. Error bars represent the standard error of the mean of three biological replicates. Strains used were DL2792 (lacZ+), DL3020 (lacZ::460bp) and DL3021 (lacZ::480bp). The DNA samples were taken before (T0) and 60 min after the induction of SbcCD expression with arabinose (A) and 60 min after the repression of SbcCD expression with glucose (G). (C and D) Quantification of DNA loss surrounding the break in palindrome-containing and palindrome-free recombination deficient cells. (C) Top panel. Southern blot showing the 7.5 kb NdeI lacZ fragment containing the palindrome. Lower panel. Southern blot showing the 10 kb NdeI cysN fragment. (D) Quantification of DNA loss. The total amount of DNA from each sample was quantified and normalized to the total DNA for the 10 kb NdeI cysN fragment on the opposite side of the chromosome. Error bars represent the standard error of the mean of three biological replicates. Strains used were DL2797 (ΔrecB lacZ+), DL3066 (ΔrecB lacZ::460bp) and DL3048 (ΔrecB lacZ::480bp). The DNA samples were taken before (T0) and 30, 60 and 120 min after the induction of SbcCD expression with arabinose (T30A, T60A and T120A) and 120 min after the repression of SbcCD expression with glucose (T120G).
