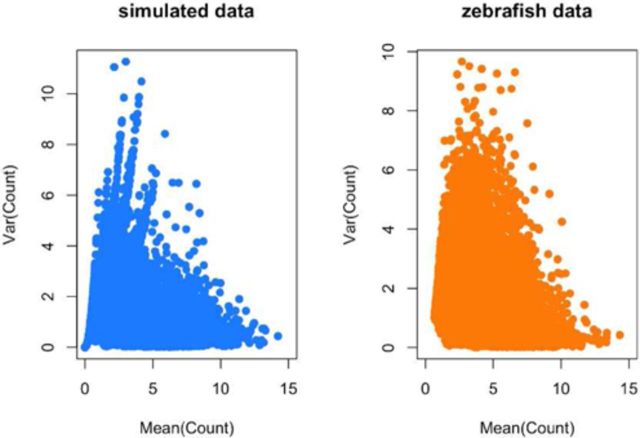
Figure 4.
Distribution of means and variances for simulated and real Zebrafish data. To confirm that my simulation procedure produced reasonable simulated counts, I plotted the gene-specific means and variances for (left panel) the simulated data set and (right panel) the observed Zebrafish data set. The two distributions are qualitatively similar. Additional checks on the simulation procedure are provided in the simulated data analysis at http://jtleek.com/svaseq/simulateData.html.

