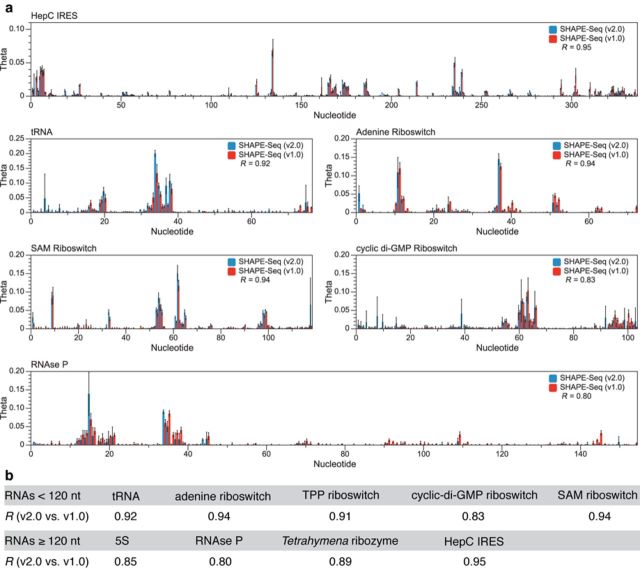
Figure 5.
SHAPE-Seq v2.0 versus SHAPE-Seq v1.0. (a) Reactivity spectra θ's are plotted for each RNA, including error bars which are calculated as standard deviations of reactivities at each nucleotide from three independent replicate experiments for SHAPE-Seq v2.0 (blue) and SHAPE-Seq v1.0 (red). Pearson's correlations from the comparisons of average reactivity spectra are shown in each plot and listed in the table in (b). Supplementary Figure S12 shows detailed comparisons for each RNA in the panel.

