Figure 1.
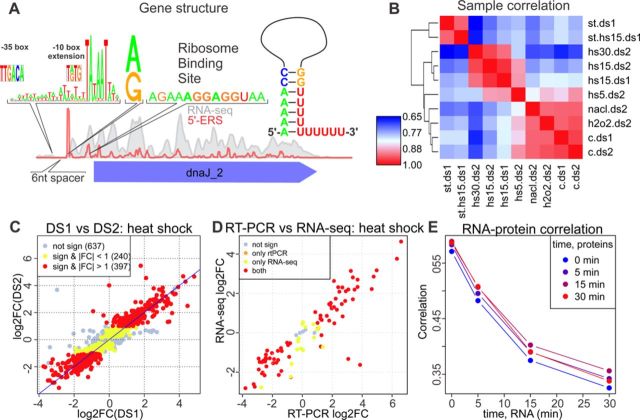
(A) Typical RNA-Seq and 5′-ERS coverage profiles near the dnaJ2 gene. The diagram of the promoter sequence, the first nucleotide of the transcript, RBS and a schematic representation of the TT are shown above the plot. (B) Correlation heatmap (correlation increases from 0.65 (blue) to 1 (red); one minus the Spearman's correlation coefficient was used as the distance metric for clustering for different conditions (c, h2o2, nacl, hs5, hs15 and hs30 denote the control, oxidative stress, osmotic stress and heat stress for 5, 15 and 30 min, respectively) and data sets (ds1 and ds2). The expression values represent the average values of the replicates. (C) Agreement of the heat shock (15 min)-related expression changes (log2-fold change) between DS1 (x-axis) and DS2 (y-axis). One dot denotes one CDS. Not significant, significant but with a fold change below 2 and significant with a fold change above 2 are shown in gray, yellow and red, respectively. (D) Agreement of the heat shock (15 min)-related expression changes between RT-PCR (x-axis, differences in cycle number) and DS2 (y-axis, log2-fold change). The same color scheme as in panel C was used. (E) Dependence of the Spearman's correlation coefficient between the protein abundance (PAI) measured for different heat shock durations (shown with different colors) and the mRNA abundance (RPKM) on the heat shock duration used for the RNA-Seq experiments.

