Figure 3.

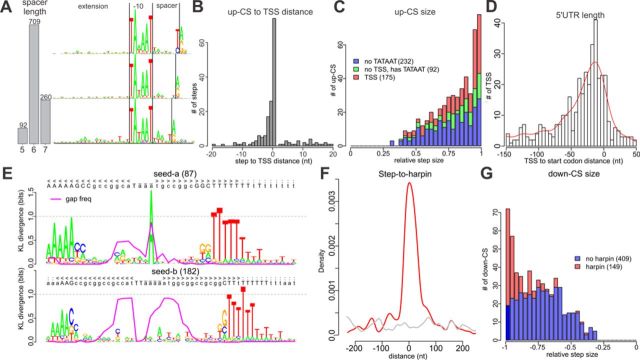
Structure of M. gallisepticum TSSs and T3Es. (A) Distribution of TSSs by spacer (between the −10 element and the TSS) length (left) and logo-images of the promoter region for each spacer length (7 to 5 nt from top to bottom). The −10 element and TSS are shown with vertical black lines. (B) Distribution of distances between the TSSs and the nearest up-CS. (C) Distribution of up-CSs by step size. The up-CSs that have 5′-ERS-detected TSSs, have only a good −10 element (detected by PWM) and have no signs of a TATAAT-like promoter are shown in red, green and blue, respectively. (D) Distribution of distances from the nearest start codon to a TSS (negative values correspond to TSSs placed before the start codon). (E) The logo-images of alignments of RNIE-predicted hairpins to two seeds. The proportion of gaps in a given position is shown with a magenta line. (F) Distribution of distances between down-CSs and RNIE-predicted hairpins. (G) Distribution of down-CSs by relative step size. The down-CSs with and without hairpins are shown in red and blue, respectively.
