Figure 4.
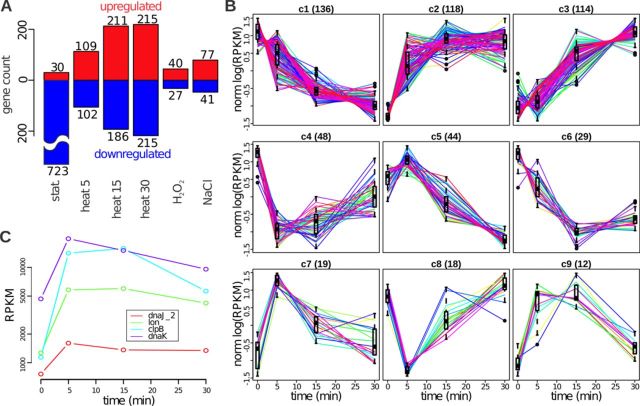
Transcription regulation. (A) Number of CDSs whose expression changes significantly under different conditions. The up- and down-regulated genes are shown in red and blue, respectively. (B) Nine patterns of gene expression changes under heat shock. The patterns are ordered by their size (shown in brackets in the panel titles). The normalized log expression of individual genes is shown with lines, and the distribution of the normalized log expression at each time point is shown with a box. (C) Gene expression profiles (RPKM) of four genes that have the CIRCE motif in the upstream region.

