Figure 5.
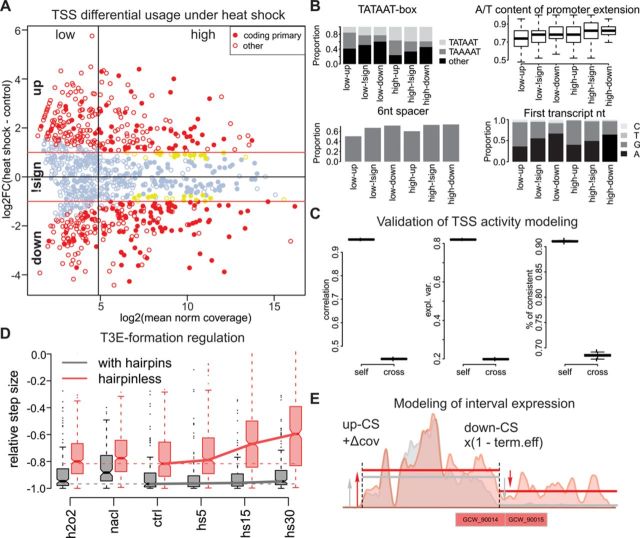
TSS and T3S formation contributions to gene expression regulation. (A) Fold change versus mean activity plot (log scale) for TSSs under heat shock. The TSSs associated with the coding genes are shown with filled circles, the TSSs with significant changes and with |FC| > 1 are shown in red, and the TSSs with significant changes but with |FC| < 1 are shown in yellow. The TSSs are divided into six groups by the change direction (up, down and not significant (denoted by ‘!sign’)) and by the average activity (low or high; the vertical line represents the median). (B) Distributions of TSS properties among the six TSS groups defined in A: type of −10 box, A/T content of the −10 element extension, proportion of promoters with a 6-nt-long spacer between the −10 element and the TSS and frequencies of first transcript nucleotide. (C) Pearson's correlation, proportion of explained variance and proportion of TSSs with the correct direction of change prediction for the self- and cross-validation of the random forest modeling of the heat-shock fold change. In total, 500 permutations were performed, and in each case, the learning and test sets consisted of 90% and 10% of 495 significant TSSs, respectively. (D) Distributions of down-CS efficiency under different conditions and dependence on the presence of hairpins. (E) Modeling of the interval expression by additive TSS and multiplicative T3S formation activity. The colored areas represent a smoothed read coverage, the interval borders are shown with vertical lines, and the mean interval coverage is shown with solid lines. The read coverage profiles under the control conditions and heat shock are shown in gray and red, respectively.

