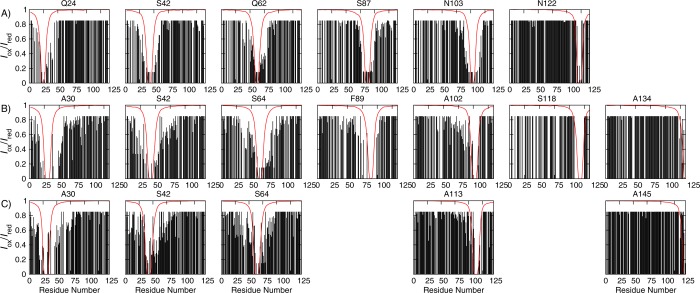
Figure 2.
Intensity ratios Iox/Ired for each spin-label position for (A) αS,12,17 (B) βS, and (C) βSHC. The experimental data are shown as black bars, and the Iox/Ired values calculated from the random coil ensemble are plotted as thick red lines. PRE–NMR experiments were conducted on 100 μM uniformly 15N-labeled protein with MTSL attached in 10 mM sodium phosphate (pH 7.4), 100 mM NaCl, and 10% D2O at 10 °C. The experimental Iox/Ired values are those processed for use in the simulations (see Methods); thus, any Iox/Ired of <0.15 or >0.85 has been set to 0.15 or 0.85, respectively. If no bar is present, then either Iox/Ired was not measured for this residue or it was discarded because of an uncertainty of >10%.

