Figure 4.
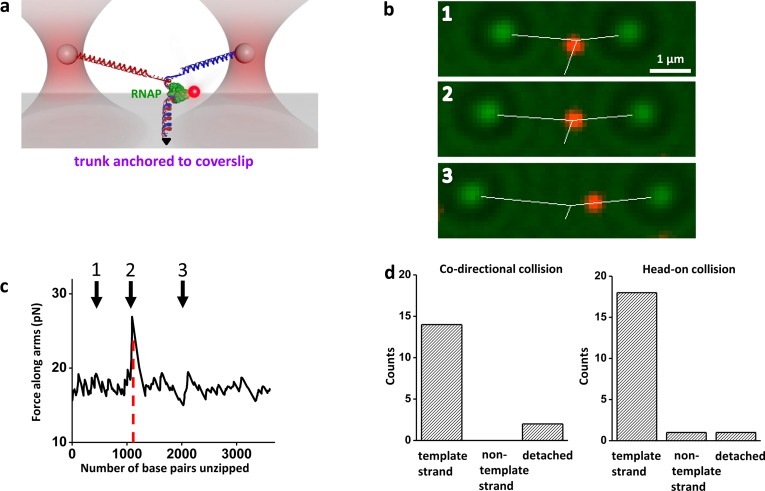
Simultaneous stretching, unzipping, and fluorescence. (a) A cartoon illustrating the experimental configuration. This Y structure contained two arms of different lengths in order to make the two arms easily distinguishable, and a trunk with a paused transcription elongation complex (TEC) formed with an HA-tagged E. coli RNAP. The RNAP was subsequently labeled by anti-HA, which was then labeled by secondary-antibody coated quantum dots. The trunk containing the RNAP was subsequently unzipped under 4 pN of force along the trunk. (b) Snapshots from video images showing the location of the RNAP (red, fluorescence images), the trapped microspheres (green, bright field images), and the real-time measured extensions of three branches of the Y structure (white lines), as the trunk DNA was unzipped through the bound RNAP, here in a head-on collision (Supporting Video 1). The RNAP was bound to the trunk DNA prior to encountering the unzipping fork and visualized by fluorescence. After the unzipping fork passed through the bound RNAP, the RNAP was retained on the template strand (the shorter Y arm). (c) Measured force along arms versus number of base pairs unzipped for the example shown in (b). The red dashed line indicates the expected active site location of the TEC. Arrows correlate the time points for images shown in (b). At time point 2, the TEC was disrupted. Data were taken at 10 kHz and filtered to 20 Hz. (d) Histograms showing RNAP fates upon unzipping. The locations of RNAP after either codirectional or head-on collisions with unzipping were determined by making multiple measurements such as those shown in b and c.

