Figure 5.

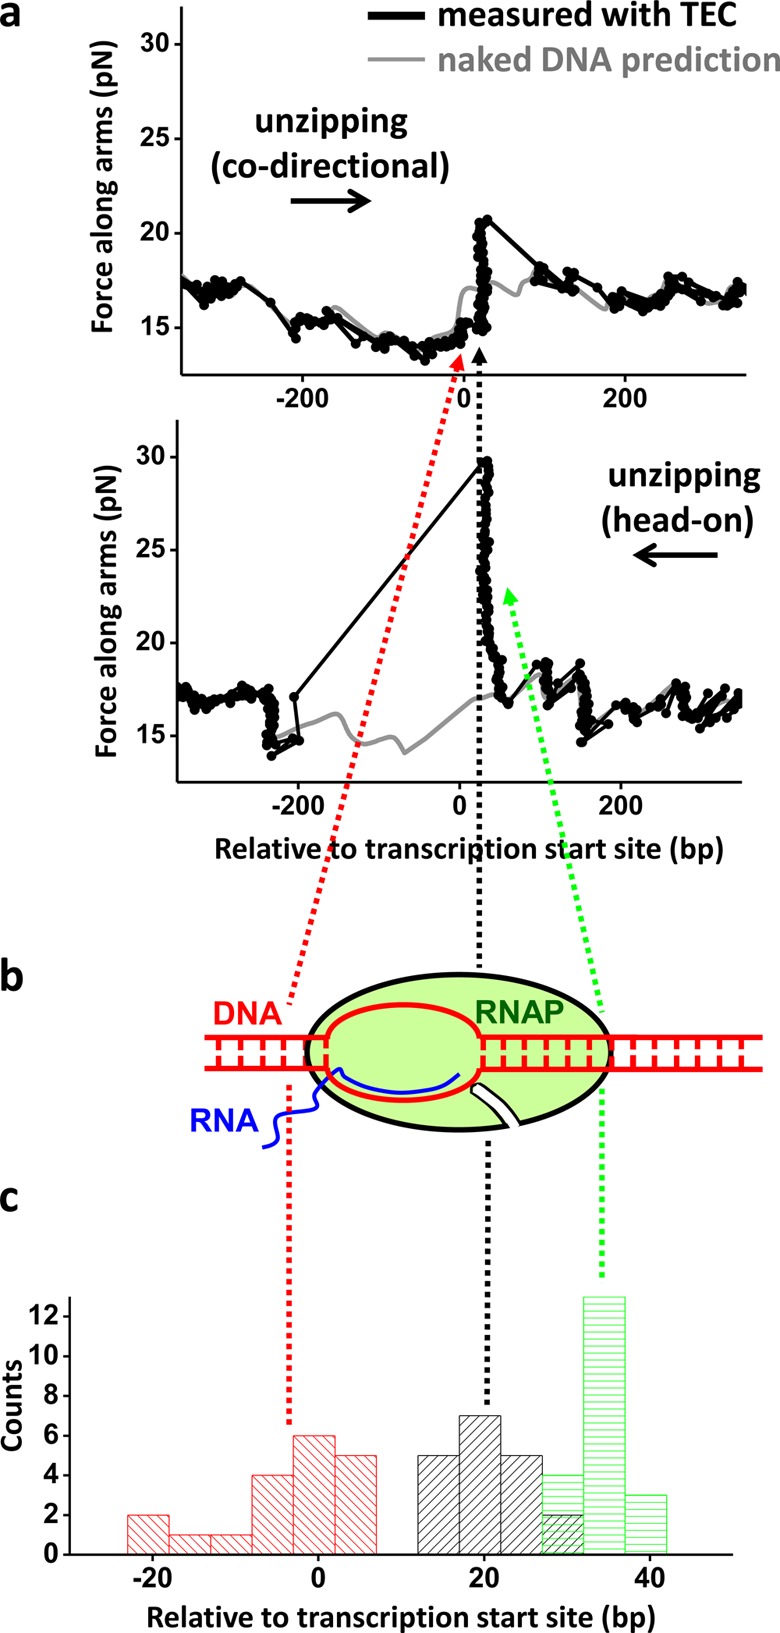
Mapping the structure of the transcription elongation complex (TEC). (a) Unzipping DNA through a TEC from either codirectional collision (top panel) or head-on collision (bottom panel) directions. The TEC was paused at +20 bp from the start site, and the trunk was held at 4 pN of force. The theoretical predictions of the unzipping force of naked DNA are also shown for comparison (gray). Three characteristic locations are highlighted. In the codirectional unzipping direction, the onset of the force drop indicates the presence of the transcription bubble, and the subsequent force rise corresponds to the end of the transcription bubble and the beginning of the dsDNA clamped by RNAP. In the head-on unzipping direction, a force rise corresponds to the onset of the RNAP interaction with the downstream dsDNA. Data were taken at 10 kHz and filtered to 20 Hz. (b) A cartoon of the TEC indicating the locations of the three detectable features discussed above. (c) An RNAP–DNA interaction map of the TEC. Three histograms were obtained by pooling a number of measurements such as those shown in a. They show the locations for the onset of the force drop (red) and the force rise peak (black) in the codirectional unzipping direction, and the force rise peak (green) in the head-on unzipping direction relative to the transcription start site (+1 bp corresponds to the transcription start site). The mean position of each histogram is indicated by a dashed line. The distance between the red and black dashed lines is ∼25 bp which is an overestimate of the actual transcription bubble size (Supporting Information). The distance between the green and black lines is ∼14 bp and provides the length of the downstream dsDNA region tightly clamped by RNAP. Note that the x-axis is zoomed in compared to the plots in a.
