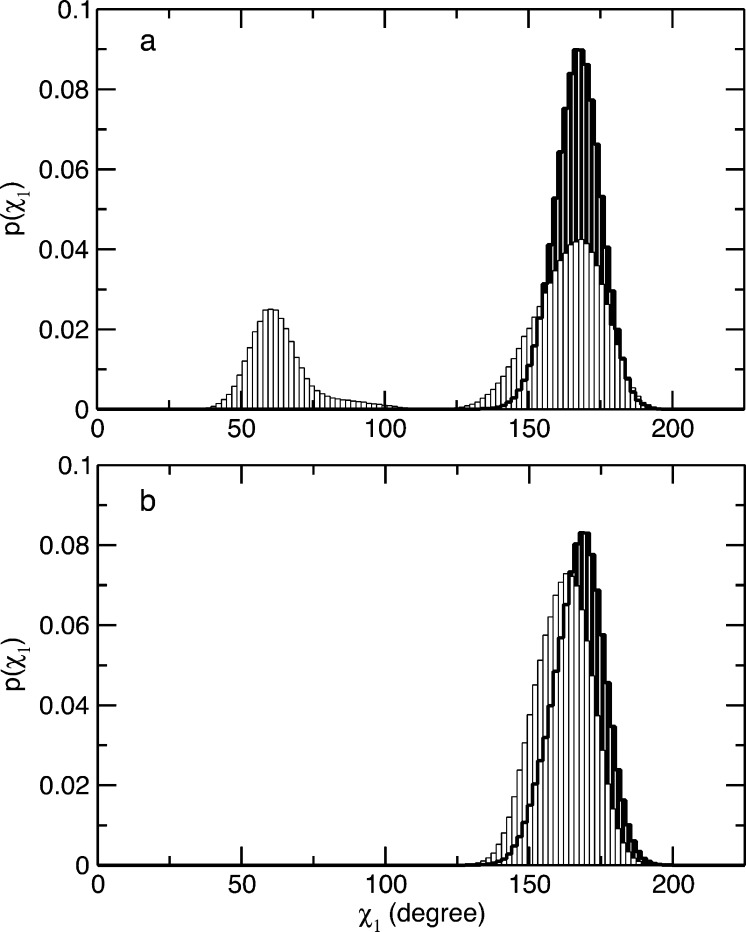
Figure 2.
Population distribution of dihedral angle χ1 of residue 97. Shown are the distributions of the populations of dihedral angle χ1, defined by the C, Cα, Cβ, and Cγ atoms of residue 97, calculated from the MD simulations of WT HbI (a) and F97Y HbI (b). The histograms calculated from the MD trajectories of the unliganded and liganded proteins are colored white and black, respectively.

