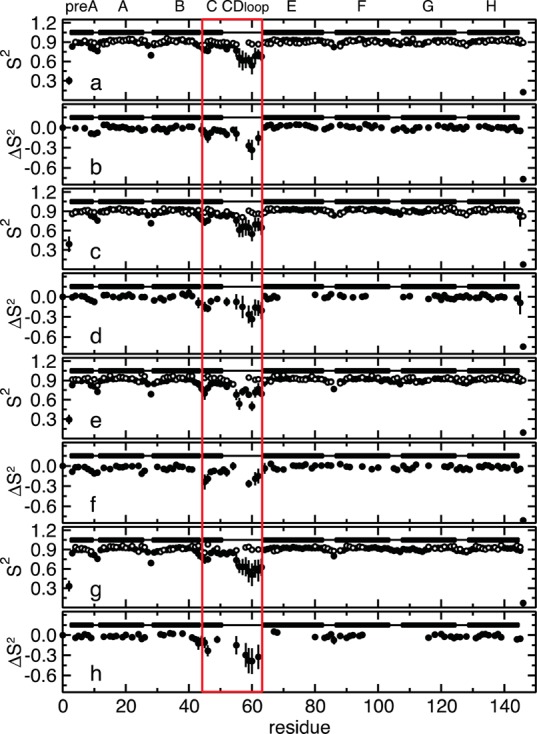
Figure 3.

Comparison of the experimentally determined order parameters, S2, with those calculated from the MD simulations. The S2 values are shown as a function of the protein sequence for WT CO-bound HbI (a), unliganded WT HbI (c), CO-bound F97Y HbI (e), and unliganded F97Y HbI (g). Experimentally determined S2 values are shown as empty circles, and S2 values calculated from the MD simulations are shown as filled circles. The difference between the simulated and experimental S2 (ΔS2 = SMD2 – Sexp2) is shown as a function of residue number for WT CO-bound HbI (b), unliganded WT HbI (d), CO-bound F97Y HbI (f), and unliganded F97Y HbI (h). Secondary structural elements are shown at the top of each plot. Solid bars represent α-helices, and lines represent loops. Helix C and the CD loop are highlighted with a red box.
