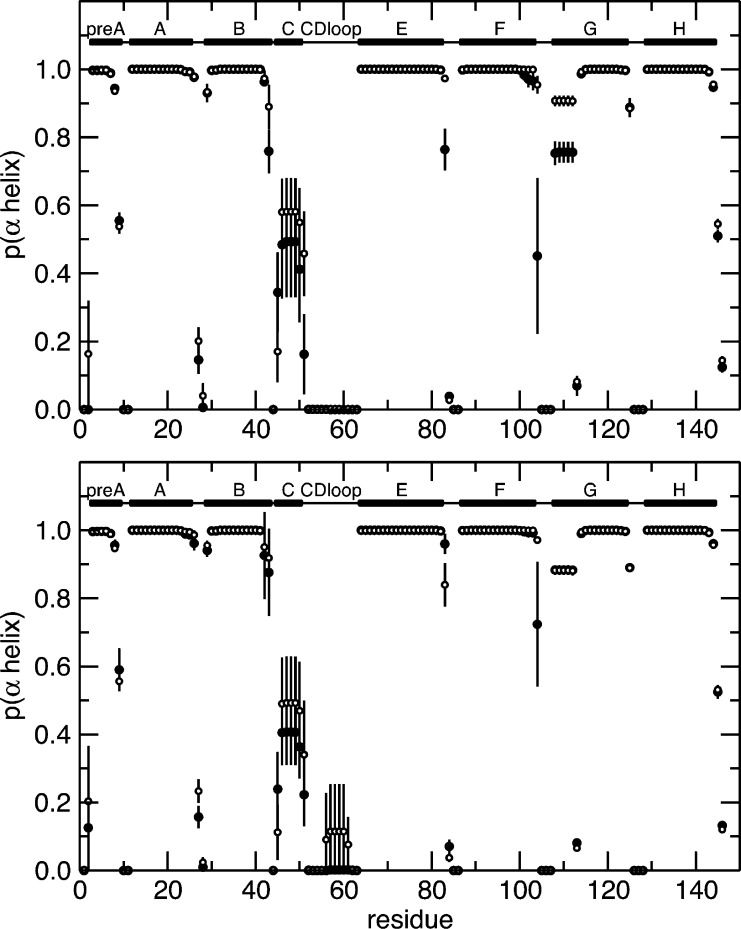
Figure 6.
Secondary structure probability. The probability of being in an α-helix is shown for each residue of HbI as a function of the protein sequence. The probabilities calculated for each residue from the MD trajectories of the unliganded and liganded protein are shown with empty and filled circles, respectively. The top plot shows the results calculated from the MD simulation of WT HbI and the bottom plot those of F97Y HbI. Secondary structural elements are shown at the top of each plot. Solid bars represent α-helices, and lines represent loops.

