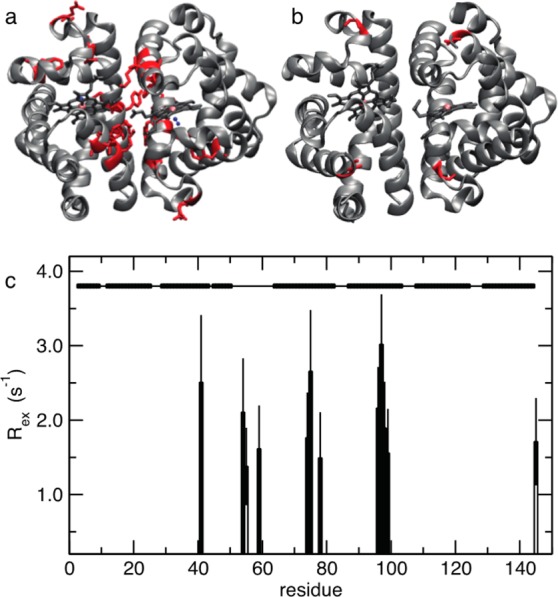
Figure 9.

Chemical exchange contributions determined from the Lipari–Szabo model-free analysis of the 15N spin relaxation measurement parameters of HbI. Residues with non-zero chemical exchange contributions, Rex, determined from 15N spin relaxation data, are mapped in red on the structure of the protein for CO-bound HbI (a) and unliganded HbI (b). The structural representation was drawn using VMD.26Rex is shown as a function of protein sequence with filled bars and empty bars for CO-bound HbI and unliganded HbI, respectively (c). Secondary structural elements are shown at the top of the plot. Solid bars represent α-helices, and lines represent loops.
