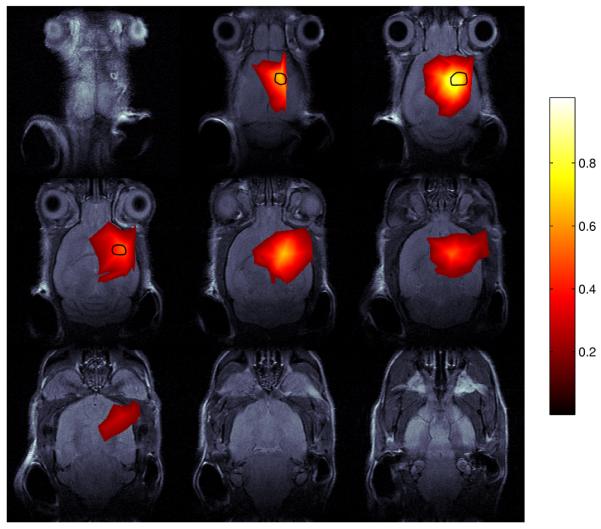
Figure 2.
The RLS image , which minimizes the cost function Φ given in (11), shown on nine horizontal planes. The reconstructed bioluminescence image was obtained by 2000 iterations of GPM-N and is overlaid on co-registered MR slices. Reconstructed values greater than or equal to 10% of the maximum value are displayed. The black contour denotes the boundary of the tumor obtained from the MR image. The color scale on the right shows relative intensity. These results are not quantitatively calibrated.

