
Figure 5.
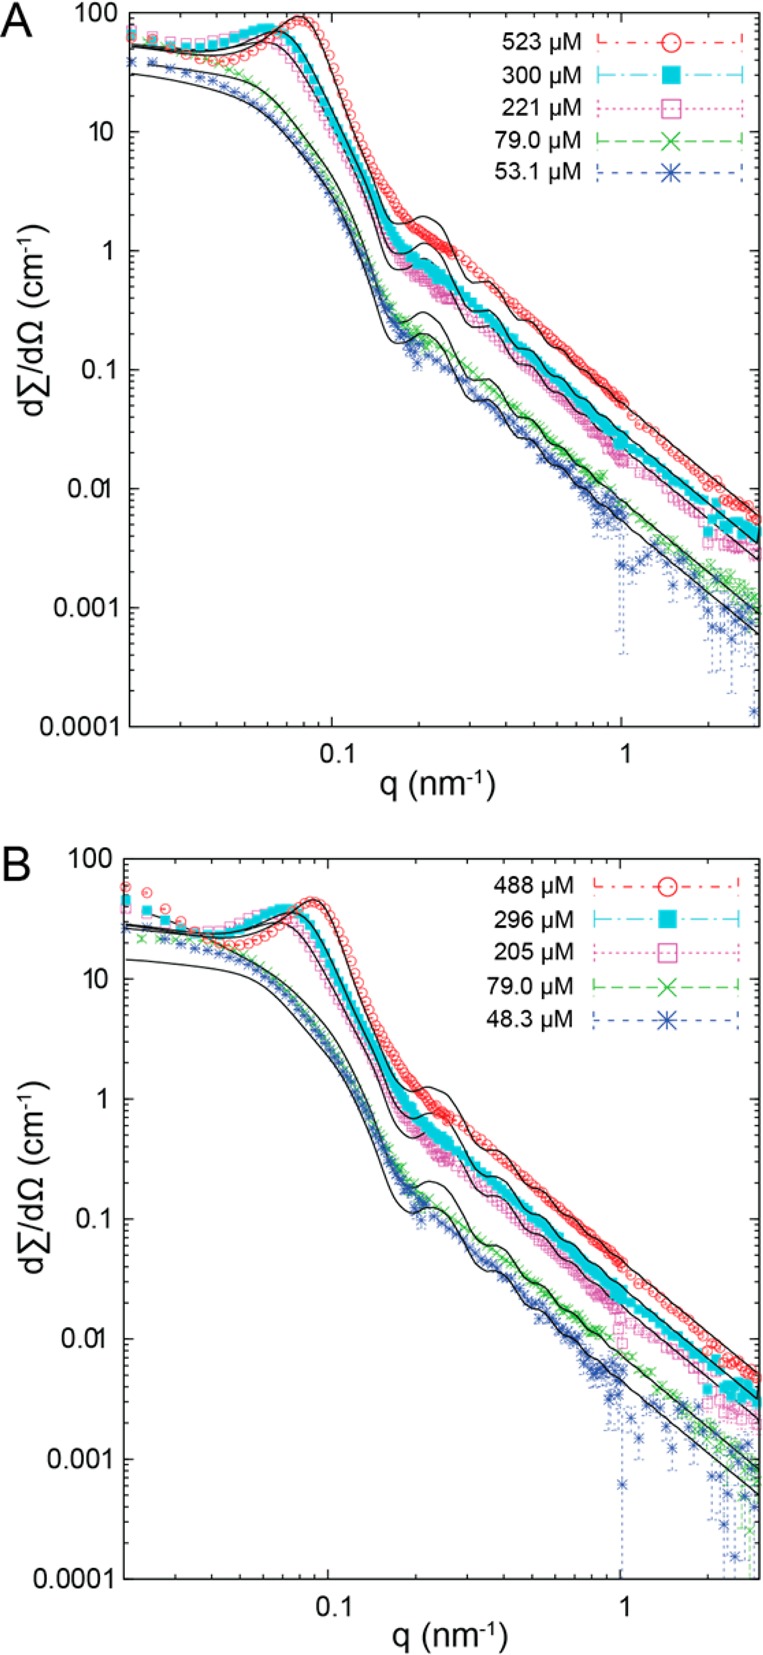
SANS spectra and analytical model fits (solid lines) for A160-(FGG)8 (A) and A160-(YG)8 (B). The q–2 slope in the mid to high q region is characteristic of the polymer chains in the hydrophilic part of the nanostructures. The structure factor peak at low q is caused by repulsive interactions between structures.