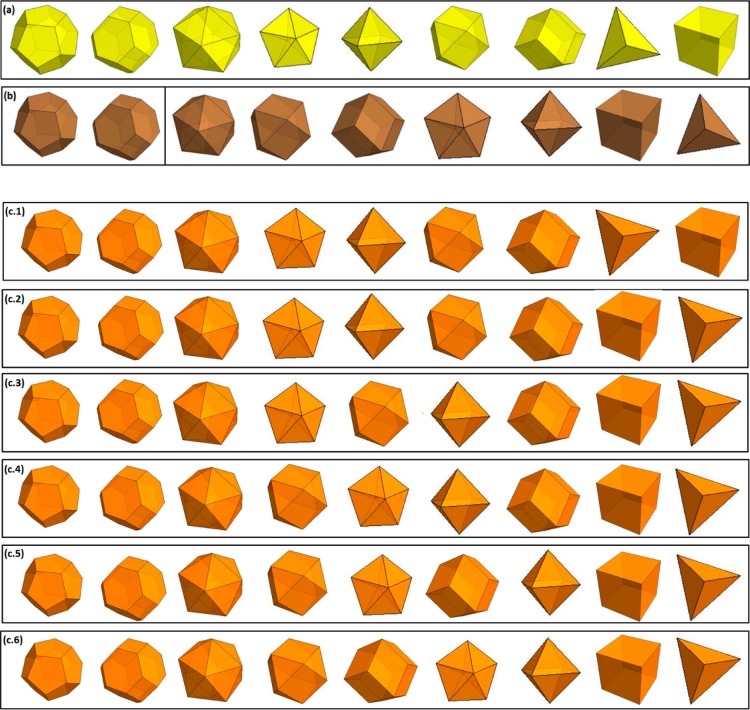
Figure 3.
Predicted sequence of preferred shapes (left to right) for (a) gold, (b) copper, and (c) copper–gold alloy at 10 and 4 nm where 1, 2, 3, 4, 5, and 6 represent different range of composition. At 10 nm, the composition ranges are: 1, 0 ≤ XCu ≤ 0.21; 2, 0.21 ≤ XCu ≤ 0.26; 3, 0.26 ≤ XCu ≤ 0.29; 4, 0.29 ≤ XCu ≤ 0.51; 5, 0.51 ≤ XCu ≤ 0.55; 6, 0.55 ≤ XCu ≤ 1. At 4 nm, the composition ranges are: 1, 0 ≤ XCu ≤ 0.03; 2, 0.03 ≤ XCu ≤ 0.22; 3, 0.22 ≤ XCu ≤ 0.24; 4, 0.24 ≤ XCu ≤ 0.51; 5, 0.51 ≤ XCu ≤ 0.54; 6, 0.54 ≤ XCu ≤ 1.

