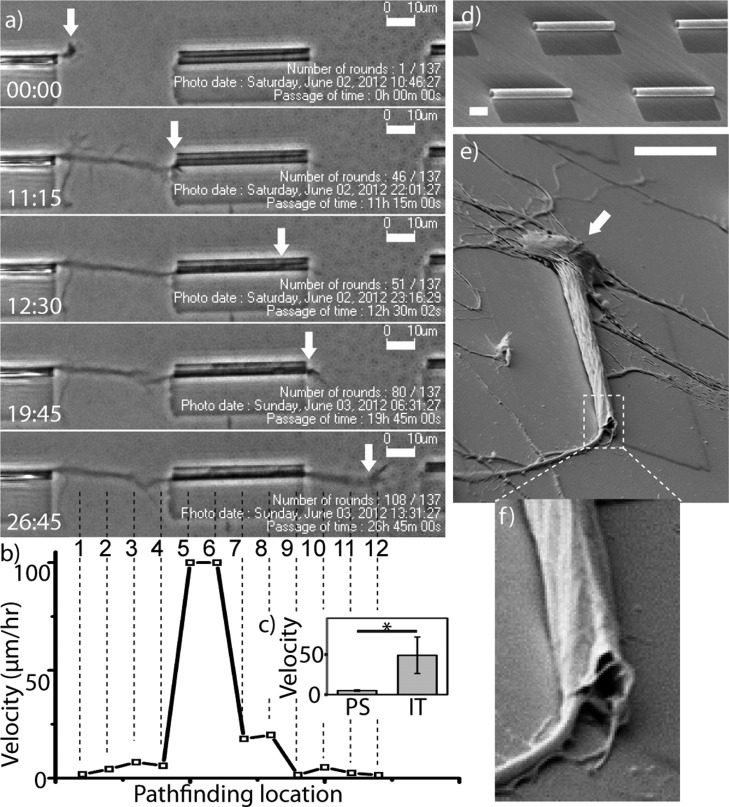
Figure 2.
Outgrowth of a single neuron in a microtube. (a) Time-lapse phase contrast images of a living cortical neuron show axonal pathfinding through a microtube. Each frame, from top to bottom, represents growth cone’s location (arrows) at key time-points (from top to bottom): 0:00, on planar glass substrate; 11:15, at tube inlet; 12:30, inside tube; 19:45, at tube outlet; 26:45, back on planar glass substrate. Time is denoted in hh:mm. Original videos of live recording are included in Supporting Information. (b) Outgrowth velocity chart shows a ∼20× acceleration as the axon extended into tubes (location #4 → #5), and decelerated to its original level while exiting onto planar substrate (location #8 → #9). Velocity was calculated for each pathfinding locations at 10 μm interval, on the basis of a live-cell recording. Each of 12 locations is marked by a numbered vertical broken-line in the last time lapse image (26:45). (c) Outgrowth velocity (μm/h) inside tube (IT) is significantly higher (12× on average) than that on planar substrate (PS) on a level of p = 0.05. (d) SEM image of the culturing substrate that contains an array of microtubes on transparent glass substrate. The fabrication detail is described in the Methods section. (e) SEM image of a single matured neuron growing in a microtube shows SiNx NM topographically conforms to the cellular surface and excludes the cell body (arrow). (f), Confirmation of microtube deformation at exiting end (∼2 μm minimum dimension), forming an enclosure and tight cell contact. (Scale bar, 10 μm).

