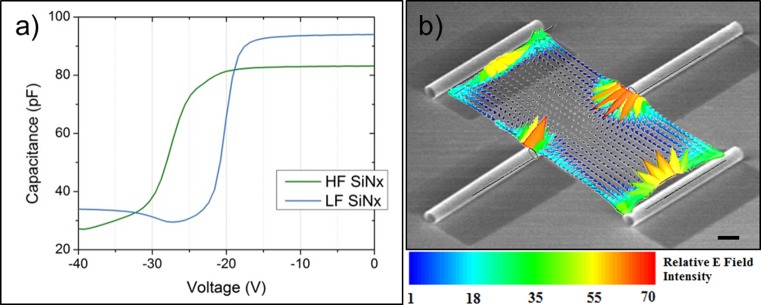
Figure 3.

Electrostatic effect of SiNx microtubes. (a) High frequency capacitance–voltage (C–V) measurement of tensile HF- and compressive LF-SiNx reveals a large flat band voltage shift to the left, indicating a large quantity of fixed positive charges within the film. (b) Superimposed SEM (in grayscale) of microtube array (10 μm scale bar) with respective mapping (in color) of electric field vectors between 40 μm pitch microtube arrays. Relative E field intensity is obtained from quasi-static FEM simulation when the side wall charge density is 36% of that at the tube opening (values are normalized to the minimum E field intensity). For more information about the FEM simulation see the Supporting Information.
