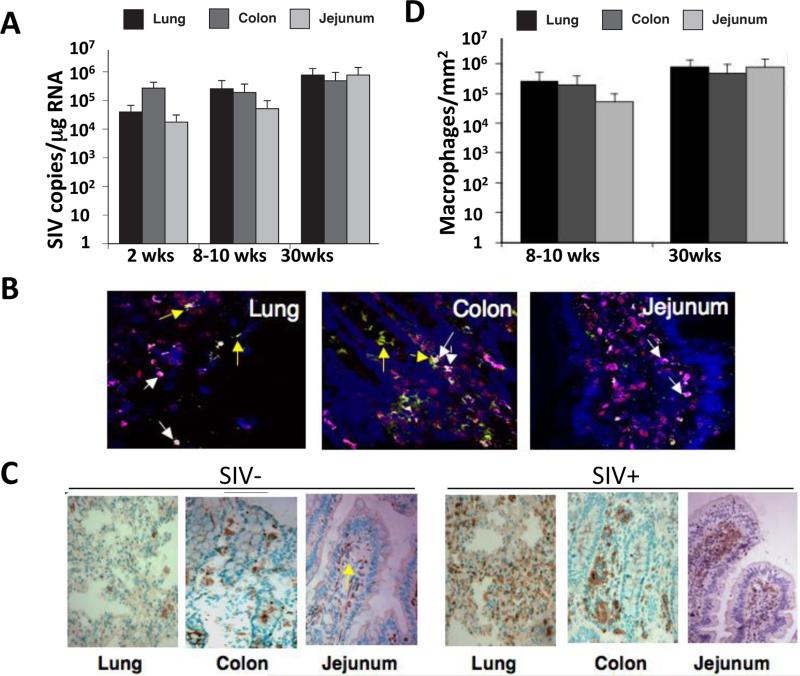
Figure 3. Comparable levels of SIV replication in the lung and gastrointestinal mucosal compartments.
(A) Comparison of mucosal viral loads (determined by real-time PCR) in the lung (black bars), colon (light gray), and jejunum (dark gray) at 8-10 weeks post infection (p.i.), and again at 30 weeks p.i. SIV copy numbers in each tissue were calculated with respect to a standard curve generated by samples with known copy numbers and values represent averages across 5 animals in each group. (mean, +/− standard error). (B) Detection and identification of SIV-infected cells was performed by immunohistochemical analysis. Location of the cells expressing SIV p27 (red color) was mapped in each 25 mucosal compartment at 30 weeks p.i. Tissues were co-stained for CD3 (green color) and Ham56 (magenta color) to determine if SIV infected cells were T-cells or macrophages, respectively. Yellow arrows represent infected CD4+ T-cells while white arrows represent infected macrophages (C) Immunohistochemical assessment of Ham56 expression indicated a similar influx of macrophages into mucosal compartments 30 weeks p.i. (D) Quantitation of Ham56+ cells in the lung, colon, and jejunum at 30 weeks post-infection (mean +/− standard error, n=3).

