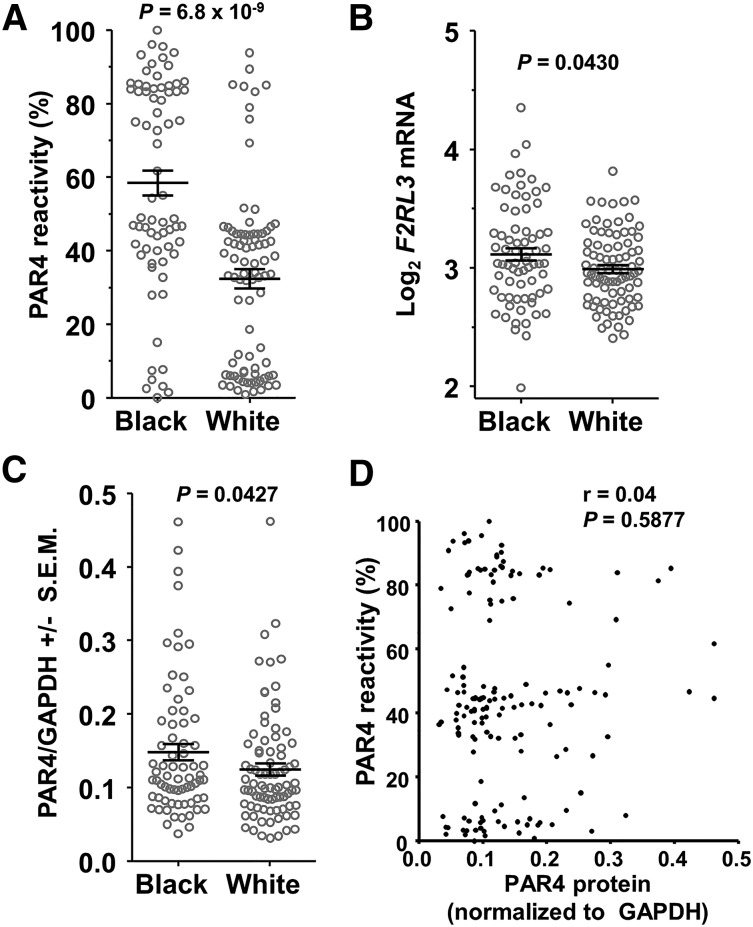
Figure 1.
SNPs in F2RL3 associate with PAR4 reactivity. (A) PAR4 ARS values of PRAX1 subjects by self-identified race. P = 6.8 × 10⁻⁹, 2-tailed t test. (B) Microarray analysis of F2RL3 gene expression. Values are normalized and log2 transformed. P = 0.043, 2-tailed t test. (C) PAR4 protein levels normalized to GAPDH. P = .0427, 1-tailed t test. (D) Correlation analysis of platelet PAR4 reactivity with PAR4 protein expression level.

